Everything happens somewhere.
Political science has studied countries and individuals. Geographical information systems let it study the places in between.
This research is from my 2016 PhD dissertation, published the same year, and has not been updated since. Later events and studies appear only where marked.
Political science has mostly studied two kinds of thing: sovereign states and the individuals inside them. Almost everything it studies also has a location, and geographical information systems let researchers join any data that share one: a battle to the district where it was fought, a survey respondent to the border nearest her home, a nineteenth-century map to a modern one.
In this 2016 article I argue that thinking spatially gives political science more data, better research designs and better theory. The running example is the Scramble for Africa, where researchers laid colonial borders over the homelands of ethnic groups and found that partitioned homelands see 40 to 60 percent more deadly conflict.
The same tools expose a trap in comparing countries: the borders that define them are themselves the products of politics. Below I show the tools at work on that example and on the maps behind three other chapters of the dissertation.
Written largely by Claude and reviewed by me. How this was made
Original publicationStatsvetenskaplig tidskrift 118(2), 2016 ↗
Research profile, University of Copenhagen ↗Dissertation chapter (PDF) ↗All editions →
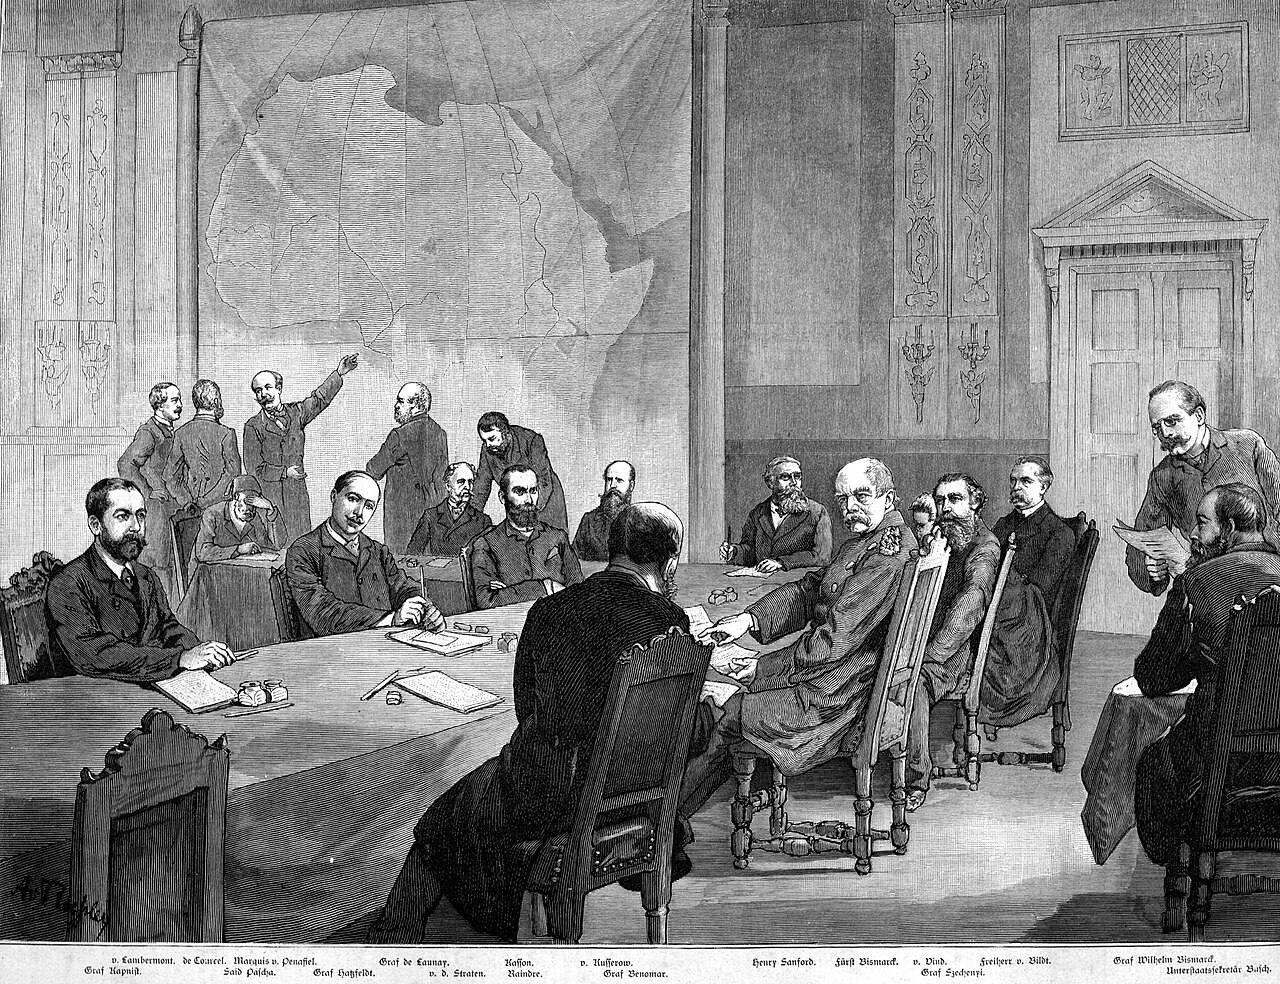

In the engraving the map hangs on the wall behind the table, and a delegate stands and points at it. Between 15 November 1884 and 26 February 1885, representatives of fourteen states met in Berlin at the invitation of Otto von Bismarck to agree the rules for dividing Africa among European powers, and no African state was invited. The lines that followed over the next decades were drawn far from Africa by people with little knowledge of who lived where, and many of them still stand.
Historians of Africa have long argued that these borders did lasting harm. A line that cuts through an ethnic group’s homeland can leave its members agitating to rejoin their kin on the other side, and gives armed groups somewhere to retreat across it. The argument is plausible, but for a century it was hard to test systematically. The evidence sat in different maps, made by different people for different purposes. What made the test possible was software for laying one map on top of another.
In this article, which became the methods chapter of my dissertation, I introduce that software, geographical information systems, to political scientists. I make three claims:
- Almost everything political scientists study has a location.
- Location is a key that can join data that otherwise have nothing in common.
- Joining data by location makes new research designs possible, including designs that avoid a trap built into comparisons of countries.
The Scramble for Africa is the article’s running example, and I use it here too, along with the maps I made for the dissertation’s other chapters.
Part 1 · The missing dimension
Political science lost its maps
Modern political science has mostly taken two things as its natural units: sovereign states and the individuals inside them. Does economic development lead to democracy? Correlate income per head with democracy across as many countries as possible, over as many years as possible. Does education make people more tolerant? Survey as many individuals as possible. International relations was built on the premise that relations between sovereign states hold the key to war and peace.
It was not always like this: the founders of academic political science in the United States, at Johns Hopkins University in the late nineteenth century, studied how ideas and institutions spread across territory, and the tradition produced Frederick Jackson Turner’s thesis about the American frontier. The behavioural revolution, with its national statistics and representative surveys, pushed geography out of the mainstream.
The older work was often rich and suggestive, but weaker at ruling out alternative explanations than the quantitative work that replaced it. A few classics kept place at the centre: V. O. Key’s Southern Politics in State and Nation (1949), Robert Dahl’s Who Governs? (1961) and Robert Putnam’s Making Democracy Work (1993).
By the 2010s the two units were under pressure from several sides. Students of the European Union pointed out that authority was moving upwards and downwards from the state. Africanists and others noted that many governments do not control all of their own territory. Studies of political behaviour found that neighbours and social networks shape how people vote. Methodologists questioned both methodological individualism and methodological nationalism.
The risk in this kind of criticism is that it ends in a shrug: politics is complicated, and everything depends on context. My proposal in the article is narrower. Cultivate what I called spatial awareness, always trying to locate politics in space, and use the tools that make location usable. The starting premise is that almost every kind of information has a geographical referent.
A country has borders existing in definite places, individuals move around in space, wars take place (also) in delimited spaces that troops, tanks or drones physically inhabit, and even rocket missiles have ranges that are limited in space.
The article, 2016
Part 2 · The toolkit
Four kinds of data and one common key
A geographical information system stores data as layers, each tied to coordinates on the earth’s surface. There are four basic kinds:
- Points are single locations: a church, a battle, the home of a survey respondent.
- Lines connect points: a road, a river, a pipeline.
- Polygons are lines that close on themselves around an area: a country, a province, a lake.
- Rasters are grids that hold a value for every cell, such as altitude, temperature, or the light that settlements emit at night, which satellites record and which researchers use as a measure of income in Africa.
Simply putting data on a map already helps. Gary King made the point in 1996: displaying data geographically connects a variable with many others measured for the same places, and most readers know the values of many of those without looking them up. In 2016, Harvard’s free WorldMap platform let anyone stack slave ports, rivers, ethnic groups and religious composition on one map of Africa with a few clicks. The figure below builds a similar stack from the dissertation’s own data and from Natural Earth, a free public collection of map layers.
Points: national capitals
Each point is one pair of coordinates
Natural Earth 1:50m capitals and rivers (public domain); survey regions and values from the Africa chapter’s archived data. The raster and all distances are new calculations, as straight-line distances from cell or region centres.
Start with points: the national capitals of Africa. A point is a single pair of coordinates, a latitude and a longitude.
Add lines: the major rivers. A line is a sequence of points. In the article I suggest distance to a major river as a useful control in many kinds of study.
Add polygons: the regions of the Afrobarometer survey used in the Africa chapter, 492 of them in 36 countries. A polygon is a line that closes on itself, and its inside carries whatever was measured there.
Add a raster. Every cell of a grid, 1.5 degrees on a side, holds its distance to the nearest national capital, which I computed here. Satellite measures of night lights or population density come in the same form.
The layers share one key, location. Pick a point, the centre of Kaduna State in northern Nigeria, and each layer can answer a question about it: which region it lies in and what that region’s residents told the survey, how far it is from the capital, how far from the nearest major river.
Joining layers is the basic operation, and these are the main kinds. If the unit of analysis is a polygon, such as a province, one can count the points inside it (battles in a civil war, say), record whether a line crosses it (a road or a river), average a raster over it (altitude, night lights), or measure how much of it overlaps with other polygons (parliamentary constituencies).
If the unit is a point, such as a survey respondent’s home, it can take on the attributes of the polygon it lies in (the soil type of the district), its distance to a line (a border, a highway), the average of a raster around it (night lights within 25 kilometres), or its distance to other points (the nearest school).
I used most of these joins in the dissertation, and three of them follow.
Points into polygons
Towns in the 1865 gymnastics register, counted into the Prussian counties of 1867
1865 register digitised by Johannes Buggle and the author; 1867 county boundaries from the Max Planck Institute for Demographic Research. Counts are the archived town-to-county join used in chapter 2.
For the Trust chapter, Johannes Buggle and I digitised the 1865 register of German gymnastics clubs, 1,697 towns in all. Each town was given coordinates and placed in the 1867 county it lay in, so that membership could be divided by the county’s population. Across Prussia’s 438 counties, the archived join places 734 register locations in 340 of them.
The censuses came in 453 counties in 1871 and 463 in 1882, so they first had to be fitted to the 438 counties of 1867: another spatial operation.
For the same chapter I laid today’s German parliamentary constituencies over a map of the German Confederation in 1864, and computed how much of each the Danish crown had ruled before that year: 1.1 percent of Schwerin-Ludwigslust, 50.4 percent of Lübeck, all of the eight Schleswig constituencies.
Every survey respondent in a constituency then inherited its share. The map shows the logic with approximate historical lines.
For the Africa chapter I measured each region’s distance from its national capital and from the nearest foreign land border, as rough measures of how firmly the centre controls its periphery.
Redrawn here, half of the regions’ centres lie within 255 kilometres of their capital; the farthest is 1,661 kilometres away.
Each of these joins made a comparison possible that tables alone could not. In the Africa chapter, placing oil and gas fields inside regions showed something that country statistics hide. Between countries, oil and Islam go together, because so many Muslim-majority states export petroleum. Between regions, they are almost unrelated, with a correlation of 0.06. That is what allowed me to separate the two explanations.
The general point is that location is a common denominator of almost all data, so datasets whose units do not match can often be made to match by adding coordinates. Historical sources, such as lists of towns, census records and old borders, can often be geocoded cheaply, and many newer sources, such as search queries and social media posts, already carry locations.
Part 3 · The worked example
Laying colonial borders over ethnic homelands
My main example in the article is a study by the economists Stelios Michalopoulos and Elias Papaioannou of the long-run effects of the Scramble for Africa, then forthcoming and since published in the American Economic Review. It shows what the four kinds of data can do together. In the steps below the shapes are a diagram; the numbers are the study’s.
Homelands before the borders
Schematic. Each hexagon stands for an ethnic homeland on a nineteenth-century map
A new diagram. The shapes are invented; the study used digitised homeland boundaries and present-day country borders.
Start with a polygon layer: the homelands of ethnic groups as ethnographers and missionaries mapped them in the middle of the nineteenth century, before the partition.
Lay today’s country borders, another polygon layer, on top. Where a border cuts a homeland, the group has been partitioned.
The features of the groups themselves, such as precolonial kingdoms, major cities, sites of battles or family structure, do not predict which homelands were split. Only two things do: the size of the homeland and the presence of a major lake. That fits borders drawn far away by people who knew little of the ground.
229 homelands are cut by at least one present-day border, and 596 are not.
To compare places within the same country, the study cuts every homeland into its national pieces. The result is a new unit of analysis, the country-ethnic area: 1,212 of them in 49 countries.
A point layer of violent events from 1997 to 2013, each geocoded where it happened by the Armed Conflict Location and Event Data Project, is then counted into the areas.
Partitioned homelands see more conflict than other homelands in the same country, also when the comparison is limited to areas near borders. The prevalence of conflict with at least one death is 40 to 60 percent higher. Neighbouring areas see smaller spillovers.
The study then links layers that were never designed to fit together. Matched to the Ethnic Power Relations dataset, which was not geocoded, partitioned groups turn out to be more likely to suffer discrimination by their governments and to be involved in ethnic civil wars. Government forces, rebels and militias, and above all foreign government forces, are more active in partitioned areas, which fits accounts of states invading neighbours to protect kin across the border.
Household surveys with locations, from the Demographic and Health Surveys, add individuals. Members of partitioned groups have lower living standards, less access to running water and electricity, and less education, and this holds wherever they live, inside or outside their group’s homeland. Members of other groups who live in partitioned areas are not worse off, and partitioned areas are no poorer in the night lights seen from space. The disadvantage travels with the members of split groups.
My reading in 2016 was that historians of Africa had largely been right about borders and violence, while the economic damage fell on members of the split groups rather than on whole regions. The study also left questions that only more spatial work could answer. It used today’s borders and did not trace how they changed after 1884. Which borders moved, and were those that split groups more likely to move later?
Part 4 · The trap in the units
Borders are not part of the landscape
Spatial data do more than add variables. They change which comparisons are possible, and that matters for a problem that comparisons of countries cannot escape on their own.
Geographers call it the modifiable areal unit problem. When local data are summarised into larger units, the summaries depend on where the boundaries are drawn whenever the variable differs from place to place. Political scientists who study gerrymandering know the phenomenon well: move the district lines, and the same voters elect different representatives.
[…] borders themselves are treated as part of the geographical landscape, like coasts or mountains. However, national borders are not a natural phenomenon; they are human-made institutions.
Alberto Alesina and Enrico Spolaore, The Size of Nations (2005), quoted in the article
For comparisons of countries the problem has a sharp edge. The number of states and the lines between them are themselves outcomes of politics: of colonisation, state capacity, federalism, secession, war and peace. Whenever the variables in a cross-country study also helped to make or unmake states, the units themselves can bias the result. The figure below shows how much the choice of units can matter, using the regional data from the Africa chapter.
Democracy ratings by region
Average answer to “how much of a democracy is this country?”, 1 to 4
Afrobarometer interviews 2002 to 2015, pooled by region from the Africa chapter’s archived data; averages weighted by the number of interviews. Squares group the 469 regions with mapped boundaries by the location of their centre. All correlations are new calculations; they are descriptive and not the chapter’s estimates.
These are the Africa chapter’s regional averages of the democracy question, pooled over 2002 to 2015. Across the 492 regions, the correlation between a region’s Muslim share and its rating is −0.27.
Average the same interviews by country, and the 36 national figures give −0.23.
Now draw boundaries that no government drew: squares of five degrees, about 550 kilometres on a side at the equator. I call units like these virtual countries. The 89 squares give −0.34.
Squares of ten degrees, 37 of them, give −0.39. The larger the squares, the stronger the correlation, though nothing about the interviews has changed.
Compare each region only with the other regions of its own country, and the sign reverses: +0.13.
That is the comparison I built the Africa chapter on. With living conditions taken into account, the estimate there is close to zero.
None of these numbers is wrong. Each describes a different set of units, and only some of those units were drawn by anyone with a stake in the answer.
In the article I apply the same worry to the Scramble for Africa study, which is mostly a comparison within countries. If partition or civil war affected how many states emerged and where their borders came to lie, the estimates are biased, which seems likely, since Africa’s two newest states, Eritrea and South Sudan, both emerged from vicious civil wars with ethnic dimensions. If borders have since moved away from conflict-prone areas and towards ethnic boundaries, groups that are still partitioned today may see less conflict than partition originally caused, and the study’s estimate would be too small.
Spatial tools also offer remedies. The analysis can be repeated using only borders that have not changed since 1885, since 1914 or since 1960. Or it can be run on virtual countries, grids whose boundaries no politics drew.
Part 5 · Where the maps lead
A spatial turn, and the field that missed it
In comparative politics, studies of party systems, ethnic relations, public goods, multilevel government and election fraud informed by geography were beginning to appear when I wrote the article. I cite Nahomi Ichino and Noah Nathan on local ethnic geography and voting in Ghana, and Peter Thisted Dinesen and Kim Mannemar Sønderskov on ethnic diversity and trust in people’s immediate surroundings. In international relations, a 2014 special issue of the Journal of Conflict Resolution on joining micro and macro approaches to civil war signalled a spatial turn.
Public administration was the odd one out, because governments use these tools constantly, to decide where to build schools, hospitals and roads and to manage the services they already run. The New York Times described in 2013 how New York City’s policy office under Mayor Michael Bloomberg relied on spatial data. Yet research on public administration, including its large literature on networks of agencies and officials whose ties depend on distance, had barely used them.
I end the article with theory. Thinking spatially can bring into view political phenomena that a focus on countries and individuals hides, and it can tie the levels of politics together: local officials, regional governments, national leaders and international actors, and the links between places at the same level.
For the Scramble for Africa, that means asking how local officials stoke or damp conflict, how local government shapes ethnic inequality, what national governments want from local outcomes, and how subnational boundaries are drawn. After 1994 Ethiopia redrew its regions around its large ethnic groups, including a Somali regional state in the east, which gave regional leaders resources that could be used in conflict. Ethiopian–Somali conflict flared from 1998 to 2003 and again from 2006 to 2009.
This chapter is the method behind the others. The dissertation asks how culture and institutions shape each other, and each of its designs depends on places: a border that moved twice across the same towns, regions that share a national state but not a religion, immigrants who carry one country’s habits into another. Most of them needed a map to define who had been exposed to what.
Geography has been studied by historians, area specialists and qualitative researchers since political science began. The tools let quantitative researchers test their accounts systematically, and give qualitative researchers another source of evidence. Maps can be a place where the two kinds of research meet.
Before asking why, ask where.