Interactive edition · Trust in Scandinavia · Chapter 2

Getting to Denmark.

The Danish–German border moved twice across the same towns. But the cultural imprint it left stopped mattering after two generations.

This research is from my 2016 PhD dissertation, published in 2018, and has not been updated since. Later events and studies appear only where marked.

Denmark is the most trusting country in Europe, and reformers everywhere want to know how it got there. Between 1864 and 1920 the border between Denmark and Germany crossed the same towns twice. The people of North Schleswig, about 160,000 by 1920, changed country without moving, and then changed back.

For a while they voted as if the old state were still around them. Within 40 to 70 years they had converged with their new neighbours, and today’s surveys find no consistent trace of the old line in how much people trust each other. If these border regions are a guide, Denmark’s lead over Germany was built mostly after 1920.

Written largely by Claude and reviewed by me. How this was made

Original publicationScandinavian Political Studies 41(1), 2018 ↗

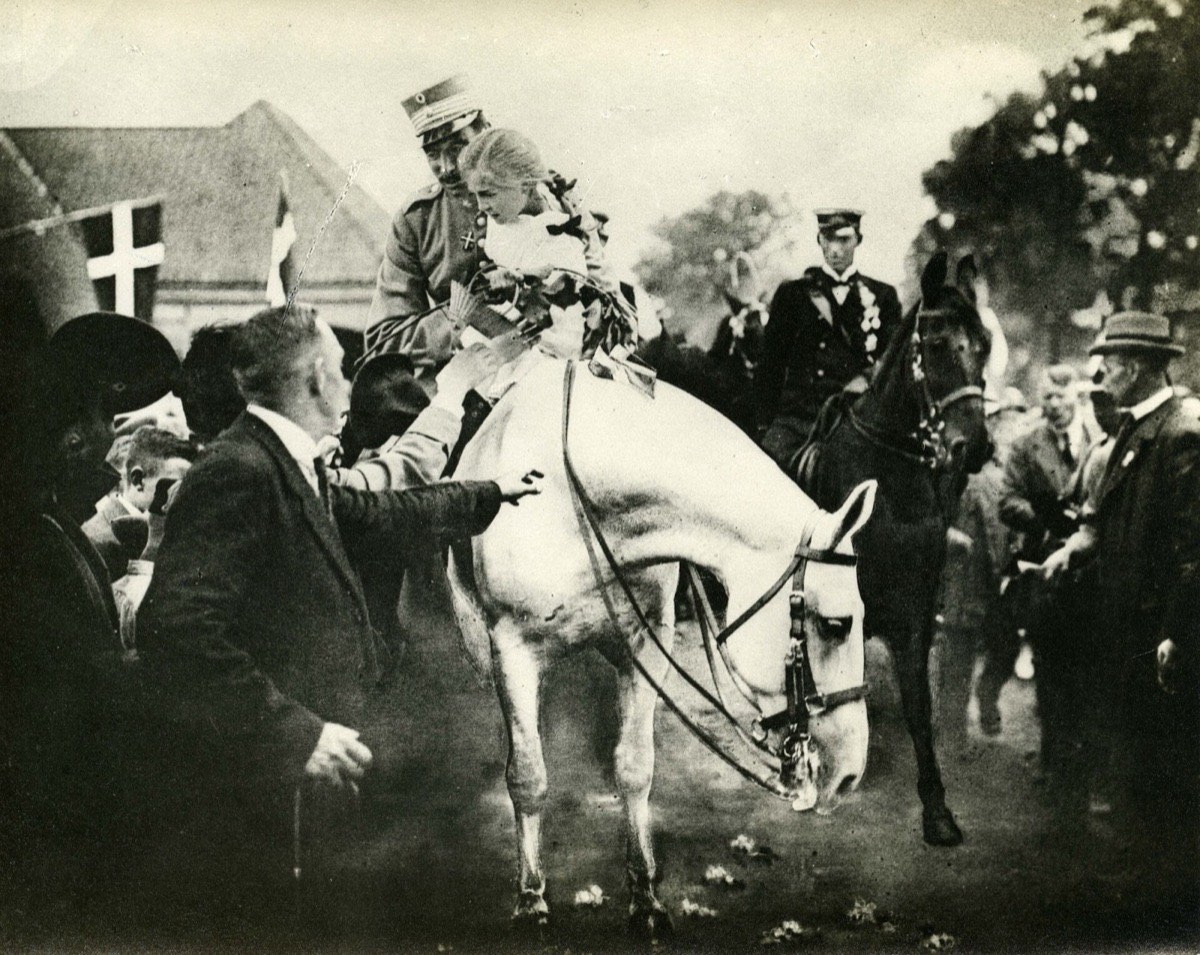
King Christian X on horseback crossing the old border on 10 July 1920, with nine-year-old Johanne Braren lifted onto his horse
10 July 1920 Frederikshøj, on the old border. King Christian X rides into North Schleswig as it returns to Denmark. The girl lifted onto his horse is Johanne Braren. Public domain, Wikimedia Commons; identification from Kristeligt Dagblad.

On 10 July 1920 King Christian X rode a white horse across the old border at Frederikshøj. A nine-year-old girl from the crowd was lifted onto the horse in front of him. Her name was Johanne Braren, and the photograph of the two of them became one of the best-known pictures of the reunion.

The people lining the road had been citizens of Prussia and then of the German Empire for 56 years. Since 1888 their children had been taught in German, yet none of them had moved. A war in 1864 had moved the border north over their farms and towns, and in 1920 a vote moved it back.

What had 56 years of German rule done to them?

That question is a small version of a large one. Political scientists have argued for decades about whether the habits that make some societies work are inherited from the deep past or rebuilt by each generation’s institutions. Denmark is the case everyone reaches for, and here I follow its southern border through two changes of rule, three kinds of evidence and a century and a half, to see how long history lasts.

Part 1 · The puzzle

Everyone wants to get to Denmark

An interviewer reads from a card: “Generally speaking, would you say that most people can be trusted, or that you can’t be too careful in dealing with people?” Zero means you can’t be too careful; ten means most people can be trusted. In survey after survey the Nordic countries answer at the top of the world’s distribution, and Denmark sits at the top of the Nordic countries.

Trust lowers the cost of almost everything a society does together, because people who expect others to cooperate need fewer safeguards and less monitoring. Studies have linked high trust to faster economic growth, lower corruption and more responsive democracy.

So the rest of the world has taken notes. The Economist called the Nordic countries “the next supermodel” in 2013. In 2016 Bernie Sanders campaigned for the American presidency holding up Denmark as a model. Development economists and political scientists even have a phrase for the ambition of building a state that is prosperous, democratic, peaceful and honest: getting to Denmark, popularised by Francis Fukuyama.

The obvious next question, and the one I start from, is how Denmark got to Denmark.

Share who say most people can be trusted

European Values Study, 1981 and 2007

0%20%40%60%80%1981200747%75%Denmark27%37%West Germany0+0.5+1+1.5+2Trust in parties+1.86Trust in politicians+1.74Most people can be trusted+1.72Trust in parliament+1.40Trust in the legal system+1.27People try to be fair+1.13People try to be helpful+0.95Trust in the police+0.74East minus West Germany
A recent rise

Surveys of the same question begin around 1980. The European Values Study found 47% of Danes saying most people can be trusted in 1981, and 75% in 2007. West Germans rose too, from 27% to 37%.

Danish trust is in some respects a recent phenomenon. A second series shows the share rising from 47% in 1979 to 79% in 2009.

A large gap

The European Social Survey asks a battery of trust questions on 0 to 10 scales. Compare Danes and Germans of the same age, sex, education, income, religion and migrant background, and Danes come out ahead on every one.

On the basic question about other people the gap is 1.72 points, about a sixth of the whole scale. The largest gap is for political parties, 1.86.

For scale

East and West Germany make a useful yardstick. They spent four decades under different regimes, and the gap between them today is likely at least partly a legacy of that. In trust in the police it is 0.44 points, and in the legal system 0.62.

The gap between Danes and Germans on the same two questions is 0.74 and 1.27. Whatever separates Denmark from Germany is one and a half to two times what separates East from West.

There are two broad answers to how the gap arose, and they have very different implications.

The first says Danish trust is old. It points to centuries of political stability and relative social harmony, to an industrialisation in the late nineteenth century driven by cooperatives of peasants who banded together to buy and share equipment, and to a striking fact about emigrants: descendants of Scandinavians who left for the United States around 1900 are still among the most trusting Americans, close to Scandinavians themselves. On this account trust is a cultural inheritance, carried in families. Some scholars have argued that it explains Nordic success, including the welfare state itself.

The second says Danish trust is recent. It points to the universal welfare states built after the Second World War, to low inequality and low corruption. People trust each other because their institutions treat them fairly and give them little reason not to. On this account trust is made, and the rise since 1980 is part of the evidence.

For governments trying to learn from Denmark, the second account is the hopeful one, because it implies that what Denmark built, others can build. The trouble is that the surveys start around 1980, when Danes were already far ahead. They cannot tell us when the gap opened. For that we need a place where the same kind of people lived under Danish and German rule at different times, and history provides one.

Part 2 · The border moves north

The border moved over people who stayed

For centuries the Danish crown ruled more than Denmark. It held the Duchy of Schleswig as a fief from the eleventh century and, from 1773, the whole of Schleswig and Holstein, which reached south to the Elbe and the edge of Hamburg. Denmark was what historians call a composite state: one king, several territories, each governed somewhat differently. The duchies were administered in German, by German-speaking landowners, under a Danish king.

Nationalism tore that arrangement apart. In 1848 German speakers in the duchies rose against Copenhagen, and the First Schleswig War that followed killed 14,000 soldiers on both sides before Russian pressure and British mediation ended it. Sixteen years later Prussia and Austria attacked.

Who ruled the border region

Blue: the Danish crown. Stone: Prussia and Germany. The red line is the state border.

DenmarkNorth SchleswigSouth SchleswigHolsteinKoldingRibeFlensburgKielHamburgDybbølto 1864

Coastlines and today’s border from Natural Earth; the 1864 line along the Kongeå, the Eider and Elbe lines and the eastern edge of Holstein are approximate. Comparison areas are drawn schematically.

Before 1864

The Danish crown rules Schleswig and Holstein, down to the Elbe. North Schleswig speaks Danish, while South Schleswig and Holstein speak German.

Denmark adopts a liberal constitution in 1849, but never extends it to the duchies.

18 April 1864

The Prussian army storms the Danish redoubts at Dybbøl. Denmark loses the war and both duchies. The border jumps north to the Kongeå, just south of Kolding.

Denmark’s population falls from about 2.5 million to 1.5 million.

1864 to 1920

Among the people who become Prussian are 520,000 German speakers in Holstein, about 200,000 German speakers in Schleswig and about 200,000 Danish speakers in North Schleswig.

Those Danish speakers will live under German rule for 56 years.

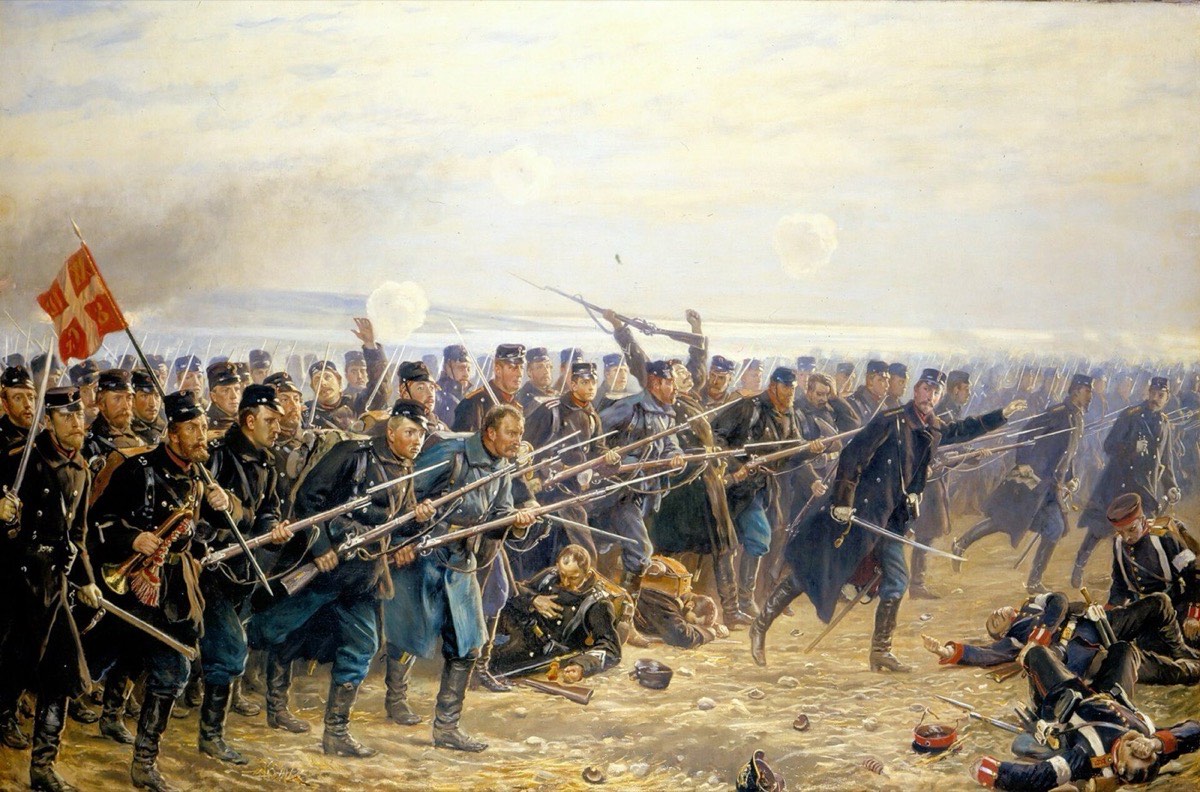
Painting of the Danish 8th Brigade's counter-attack at Dybbøl, 18 April 1864
18 April 1864 Dybbøl. The Danish 8th Brigade counter-attacks on the day the redoubts fell, as Vilhelm Rosenstand painted it thirty years later (1894). Public domain, Wikimedia Commons.

Defeat at Dybbøl became a national trauma, and Denmark answered it by turning inward. The poet H. P. Holst gave the country its slogan in 1872:

For every loss replacement is found; what was lost outwards must be won inwards.Hvad udad tabtes, det må indad vindes.

H. P. Holst, 1872, the motto of Danish nation building after 1864

What followed in Denmark is remembered as the age of associations: a flurry of popular mass movements, voluntary organisations and free church congregations. Politically the country kept moving towards self-government. Parliament won sovereignty over the king in 1901, and broad enfranchisement in 1915 made Denmark a full democracy.

North Schleswig lived through the same decades inside a different state. The German Empire held national elections from 1871 under a formally secret ballot, though effective safeguards for secrecy came only in 1903. Prussia’s separate state elections used a three-class system in which a man’s tax payments determined the weight of his vote. The parliament faced a very strong executive under the chancellor, Otto von Bismarck. Danish newspapers and associations campaigning for reunion were pursued by the authorities. Shortly after 1866 North Schleswigers signed a petition for a referendum on their future; 27,473 people put their names to it. From 1888 the state schools taught in German only, except in religion lessons.

The Danish speakers organised in response. They built “free” congregations, “free” schools and about fifty meeting houses to keep the language alive. That detail matters later: being a repressed minority can also make a community pull together.

What separated the two states

The paper’s summary of the difference between Danish and German rule in the border region

Danish ruleGerman rule
Before 1864Absolute monarchy until a liberal constitution in 1849, after steps from 1830: a freer press and advisory assemblies from 1835. The duchies never received the 1849 constitution.Absolutist outside the free cities. The revolutions of 1848 and 1849 were put down.
1864 to 1920Constitutional rule; parliamentary sovereignty from 1901; full democracy in 1915. The “age of associations”.Elections from 1871, with no secret ballot and, in Prussia, votes weighted by taxes paid. A strong executive under Bismarck.
MinoritiesGerman speakers in the duchies were a minority before 1864.Danish speakers in North Schleswig were a minority from 1864 to 1920.
Much the sameProfessional bureaucracies built on similar lines, and similarly unequal landholding in Holstein and much of Schleswig. The design cannot test these.

The difference between the two states, in other words, was mostly about liberty: how freely people could print, meet, organise and vote. It was not about the quality of administration. Danish officials had been trained along German lines since the seventeenth century, and the Prussian bureaucracy was comparably professional. Nor was it about land: the great estates of Holstein and much of Schleswig were as unequal as those of Prussia. So this is a test of liberal, representative rule, and of what being a minority does to a community. It cannot test bureaucracy or land reform.

Part 3 · The border moves back

A vote drew the line where it still runs

Germany lost the First World War, and the peace settlement offered Schleswig a choice. The plebiscite was held in two zones. The northern zone voted first, on 10 February 1920, and the central zone, which included Flensburg, on 14 March.

How Schleswig voted in 1920

Share of valid votes for Denmark (blue) and Germany (stone)

Zone I, the north · 10 February 1920

74.9% Denmark

75,431 votes for Denmark, 25,329 for Germany

Zone II, including Flensburg · 14 March 1920

80.2% Germany

12,800 votes for Denmark, 51,742 for Germany

Official plebiscite returns. The Danish government drew the voting zones, cutting across German administrative divisions (Schultz Hansen and Becker Christensen 2008).

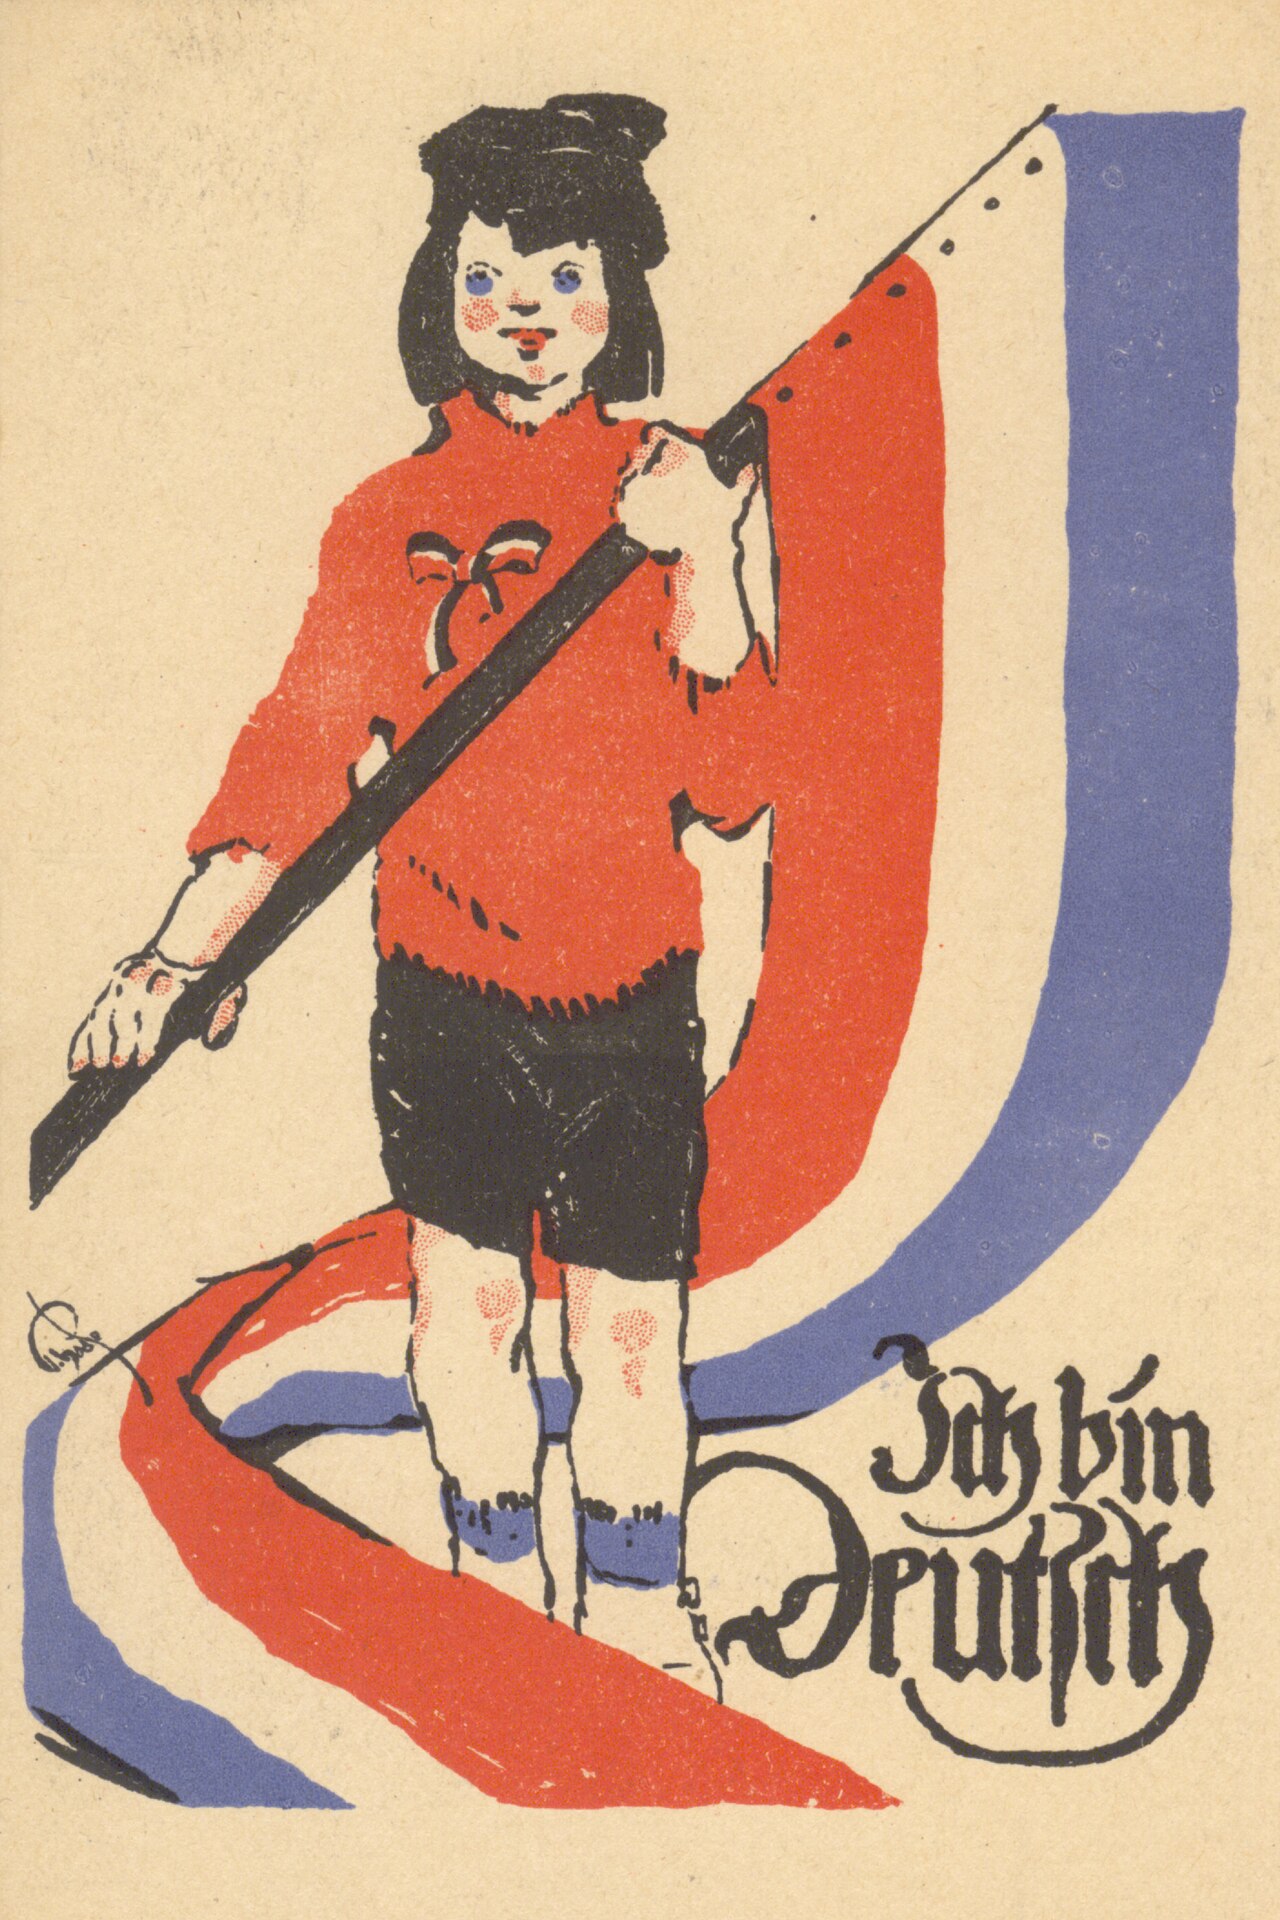
A 1920 German plebiscite postcard showing a child holding the Schleswig-Holstein flag and the words Ich bin Deutsch
1920 “I am German.” A plebiscite postcard by Paul Haase for the German side. Public domain, Wikimedia Commons.

The north voted three to one for Denmark after two generations inside Germany. The zone just south of it voted four to one the other way. The new border followed the line between the zones, close to the language boundary, and it has not moved since.

That gives me two natural experiments, one on each side of today’s border. In 1864 the duchies of South Schleswig and Holstein left Denmark for good. In 1920 North Schleswig came back after 56 years away.

Neither line was drawn at random. The 1864 border followed existing administrative units, and the 1920 border followed the vote, and therefore language. This is useful, because it means I can compare German speakers with German speakers and Danish speakers with Danish speakers, holding the most obvious cultural difference, language, constant.

Who ruled the border region

Blue: the Danish crown. Stone: Prussia and Germany. The red line is the state border.

DenmarkNorth SchleswigSouth SchleswigHolsteinKoldingRibeFlensburgKielHamburgDybbøl1920

Coastlines and today’s border from Natural Earth; the 1864 line along the Kongeå, the Eider and Elbe lines and the eastern edge of Holstein are approximate. Comparison areas are drawn schematically.

Today’s border

Since 1920 the border has run just north of Flensburg. North Schleswig is the Danish region of South Jutland; the former duchies form most of the German state of Schleswig-Holstein.

Two comparisons

In Germany: compare the former Danish duchies with their German-speaking neighbours to the south, in Hamburg, Lower Saxony and Bremen. If Danish rule before 1864 built lasting trust, the duchies should still be ahead.

In Denmark: compare North Schleswig with the Danish areas just north of the old 1864 border. If 56 years of German rule eroded trust, North Schleswig should still be behind.

The beauty of a border that moved twice is that the two tests predict opposite signs. A legacy of liberal Danish rule should push the duchies up and North Schleswig down. A legacy of minority life should push both up, because both spent decades as a minority defending their language against a state run by the other side. So the evidence can tell the two accounts apart.

Part 4 · The first evidence

The ballot box remembered for two generations, then forgot

Nobody asked people in 1871 whether they trusted their neighbours. But they did vote, and voting is a reasonable place to look. Turnout is behaviour rather than an answer to an interviewer, it covers the whole electorate, and in today’s surveys people who trust others are more likely to vote; in the European Social Survey the correlations for Denmark and Germany are about 0.2.

Germany began holding elections to the national parliament in 1871. I take every constituency in the former duchies and every constituency in the neighbouring German states, and follow the difference in turnout from 1871 to 2009, leaving out the Danish-speaking constituencies so that this is German speakers compared with German speakers. In Denmark I do the same for North Schleswig and its Danish neighbours from the first election after reunion to 2011.

Former Danish duchies minus their German neighbours

Turnout difference in percentage points at each election

−12−8−40+4+8+121880190019201940196019802000Election year

Constituency turnout, treated areas minus the neighbouring border sample (CLEA database). The transcription used here has 36 German and 30 Danish elections; the paper reports 37 German elections. Smoothed lines are new calculations; there are no free elections in Germany between 1933 and 1949.

Germany, 1870s to 1890s

When elections begin, the former Danish duchies turn out more than their German neighbours. On the trend line the early advantage is four to six percentage points, a third to a half of a standard deviation of turnout across the 37 elections.

Single elections swing widely around that trend, from almost no difference in 1871 to about ten points in 1874 and 1877.

Germany, to 1933 and after

After that the advantage shrinks, and by March 1933, the last competitive election before the Nazi dictatorship and almost seventy years after the border moved, only a small difference remains.

After the war the differences cluster around zero.

Denmark, 1920 and 1924

North Schleswig shows the mirror image. In its first two elections back in Denmark it votes 12.0 and 9.9 points less than the Danish areas just to the north.

That is more than three times the usual spread between these constituencies.

Denmark, after 1926

The deficit closes fast, and apart from two outliers, 1939 and 1943, the differences after the 1950s are within a few points of zero.

Side by side

Line the two regions up by years since the border moved and the pattern is plain. One starts above zero and one below, and both drift to their neighbours’ level.

Both reach the national average after 40 to 70 years.

The first thing that stands out is that the signs are opposite, just as a legacy of liberal rule predicts. Former Danish rule goes with more voting in Germany, former German rule with less voting in Denmark. If being a repressed minority had mobilised communities, both regions should have voted more. They did not, which also rules out the idea that any change of state simply unsettles people for a while: the duchies changed state too, and voted more than their neighbours.

The second is that the effects fade, and within a lifetime the voting habits that the old state left behind had all but disappeared.

There is a second test, from associations rather than ballots: how many people belonged to a gymnastics club in 1865, county by county across Prussia.

The 1865 club register

Associational life, county by county

Ostprignitz 0.77 members per 100 inhabitants 547 members · 70,857 inhabitants 6 register locationsRuppin 0.11 members per 100 inhabitants 87 members · 76,752 inhabitants 2 register locationsWesthavelland 0.28 members per 100 inhabitants 207 members · 72,731 inhabitants 2 register locationsTemplin 0.38 members per 100 inhabitants 174 members · 46,240 inhabitants 3 register locationsPrenzlau 0.22 members per 100 inhabitants 120 members · 55,448 inhabitants 1 register locationsLandsberg 0.19 members per 100 inhabitants 147 members · 77,992 inhabitants 1 register locationsUckermunde 0.20 members per 100 inhabitants 90 members · 44,092 inhabitants 2 register locationsAnklam 0.22 members per 100 inhabitants 68 members · 30,834 inhabitants 1 register locationsGrimmen 0.61 members per 100 inhabitants 239 members · 38,944 inhabitants 3 register locationsGreifswald 0.81 members per 100 inhabitants 450 members · 55,555 inhabitants 3 register locationsKammin 0.31 members per 100 inhabitants 134 members · 43,825 inhabitants 2 register locationsGreifenberg 0.08 members per 100 inhabitants 32 members · 38,459 inhabitants 1 register locationsFurstentum 0.22 members per 100 inhabitants 250 members · 112,490 inhabitants 3 register locationsWestprignitz 0.93 members per 100 inhabitants 684 members · 73,491 inhabitants 7 register locationsOsthavelland 0.46 members per 100 inhabitants 320 members · 69,085 inhabitants 3 register locationsNiederbarnim 0.46 members per 100 inhabitants 388 members · 83,597 inhabitants 5 register locationsZauch-Belzig 0.21 members per 100 inhabitants 140 members · 67,567 inhabitants 4 register locationsJuterbog-Luckenwalde 0.50 members per 100 inhabitants 300 members · 59,613 inhabitants 4 register locationsTeltow 0.33 members per 100 inhabitants 315 members · 94,678 inhabitants 4 register locationsLuckau 0.10 members per 100 inhabitants 58 members · 60,529 inhabitants 1 register locationsKalau 0.60 members per 100 inhabitants 288 members · 48,156 inhabitants 4 register locationsLubben 0.30 members per 100 inhabitants 102 members · 34,268 inhabitants 1 register locationsBeeskow-Storkow 0.10 members per 100 inhabitants 45 members · 42,874 inhabitants 1 register locationsSpremberg 1.17 members per 100 inhabitants 250 members · 21,385 inhabitants 1 register locationsKottbus 0.72 members per 100 inhabitants 457 members · 63,446 inhabitants 2 register locationsSorau 0.33 members per 100 inhabitants 272 members · 82,429 inhabitants 3 register locationsGuben 0.11 members per 100 inhabitants 67 members · 59,564 inhabitants 1 register locationsKrossen 0.20 members per 100 inhabitants 121 members · 59,851 inhabitants 2 register locationsLebus 0.37 members per 100 inhabitants 501 members · 134,640 inhabitants 3 register locations Population denominator is the archived pooled Lebus–Frankfurt (Oder) county unit.Sternberg 0.35 members per 100 inhabitants 319 members · 91,906 inhabitants 3 register locationsZullichau-Schwiebus 0.00 members per 100 inhabitants 0 members · 48,926 inhabitants 0 register locationsBerlin 0.00 members per 100 inhabitants 0 members · 702,437 inhabitants 0 register locationsOberbarnim 0.41 members per 100 inhabitants 295 members · 72,351 inhabitants 6 register locationsAngermunde 0.21 members per 100 inhabitants 140 members · 65,281 inhabitants 3 register locationsKönigsberg 0.31 members per 100 inhabitants 279 members · 91,359 inhabitants 5 register locationsGreifenhagen 0.57 members per 100 inhabitants 309 members · 53,824 inhabitants 3 register locationsSoldin 0.12 members per 100 inhabitants 57 members · 47,575 inhabitants 2 register locationsFriedeberg 0.80 members per 100 inhabitants 442 members · 55,553 inhabitants 3 register locationsArnswalde 0.33 members per 100 inhabitants 142 members · 42,578 inhabitants 2 register locationsPyritz 0.23 members per 100 inhabitants 98 members · 43,330 inhabitants 1 register locationsSaatzig 0.16 members per 100 inhabitants 103 members · 64,226 inhabitants 2 register locationsDramburg 0.35 members per 100 inhabitants 131 members · 36,929 inhabitants 2 register locationsNaugard 0.41 members per 100 inhabitants 234 members · 56,744 inhabitants 3 register locationsStettin (urban) 1.14 members per 100 inhabitants 843 members · 73,721 inhabitants 4 register locationsRegenwalde 0.18 members per 100 inhabitants 87 members · 48,138 inhabitants 2 register locationsBelgard 0.30 members per 100 inhabitants 129 members · 43,673 inhabitants 2 register locationsNeustettin 0.10 members per 100 inhabitants 74 members · 72,583 inhabitants 1 register locationsButow 0.00 members per 100 inhabitants 0 members · 24,810 inhabitants 0 register locationsLauenburg 0.41 members per 100 inhabitants 176 members · 42,979 inhabitants 1 register locationsRothenburg 0.30 members per 100 inhabitants 157 members · 52,082 inhabitants 2 register locationsGorlitz 0.42 members per 100 inhabitants 352 members · 83,353 inhabitants 2 register locationsLauban 0.34 members per 100 inhabitants 219 members · 64,830 inhabitants 4 register locationsLowenberg 0.25 members per 100 inhabitants 171 members · 69,369 inhabitants 2 register locationsHirschberg 0.38 members per 100 inhabitants 233 members · 61,764 inhabitants 3 register locationsLandeshut 0.46 members per 100 inhabitants 201 members · 43,585 inhabitants 2 register locationsWaldenburg 0.41 members per 100 inhabitants 368 members · 89,583 inhabitants 5 register locationsOhlau 0.10 members per 100 inhabitants 56 members · 53,544 inhabitants 1 register locationsStrehlen 0.11 members per 100 inhabitants 36 members · 32,324 inhabitants 1 register locationsMunsterberg 0.14 members per 100 inhabitants 45 members · 33,188 inhabitants 1 register locationsFrankenstein 0.08 members per 100 inhabitants 39 members · 49,861 inhabitants 1 register locationsNeurode 0.06 members per 100 inhabitants 28 members · 47,795 inhabitants 1 register locationsGlatz 0.09 members per 100 inhabitants 53 members · 60,547 inhabitants 1 register locationsHabelschwerdt 0.12 members per 100 inhabitants 71 members · 58,317 inhabitants 1 register locationsBrieg 0.20 members per 100 inhabitants 106 members · 53,723 inhabitants 1 register locationsNamslau 0.00 members per 100 inhabitants 0 members · 36,214 inhabitants 0 register locationsKreuzburg 0.28 members per 100 inhabitants 116 members · 40,737 inhabitants 3 register locationsSchildberg 0.18 members per 100 inhabitants 106 members · 59,295 inhabitants 1 register locationsOppeln 0.00 members per 100 inhabitants 4 members · 99,217 inhabitants 1 register locationsRosenberg (Oppeln) 0.00 members per 100 inhabitants 0 members · 46,592 inhabitants 0 register locationsBirnbaum 0.16 members per 100 inhabitants 78 members · 48,094 inhabitants 2 register locationsBomst 0.19 members per 100 inhabitants 106 members · 55,458 inhabitants 2 register locationsAdelnau 0.00 members per 100 inhabitants 0 members · 54,050 inhabitants 0 register locationsPleschen 0.11 members per 100 inhabitants 61 members · 57,822 inhabitants 1 register locationsWreschen 0.00 members per 100 inhabitants 0 members · 38,539 inhabitants 0 register locationsGnesen 0.14 members per 100 inhabitants 82 members · 57,474 inhabitants 1 register locationsMogilno 0.00 members per 100 inhabitants 0 members · 42,484 inhabitants 0 register locationsInowrazlaw 0.09 members per 100 inhabitants 66 members · 72,768 inhabitants 1 register locationsHoyerswerda 0.81 members per 100 inhabitants 257 members · 31,778 inhabitants 2 register locationsSagan 0.41 members per 100 inhabitants 226 members · 55,069 inhabitants 2 register locationsBunzlau 0.19 members per 100 inhabitants 110 members · 58,947 inhabitants 2 register locationsSprottau 0.40 members per 100 inhabitants 138 members · 34,410 inhabitants 1 register locationsGrunberg 0.32 members per 100 inhabitants 164 members · 50,876 inhabitants 1 register locationsFreistadt 0.15 members per 100 inhabitants 76 members · 51,657 inhabitants 2 register locationsLuben 0.13 members per 100 inhabitants 42 members · 33,223 inhabitants 1 register locationsGoldberg-Hainau 0.51 members per 100 inhabitants 255 members · 50,168 inhabitants 2 register locationsGlogau 0.16 members per 100 inhabitants 121 members · 75,789 inhabitants 1 register locationsGuhrau 0.25 members per 100 inhabitants 93 members · 37,916 inhabitants 1 register locationsSteinau 0.12 members per 100 inhabitants 30 members · 24,447 inhabitants 1 register locationsFraustadt 0.05 members per 100 inhabitants 34 members · 61,986 inhabitants 1 register locationsWohlau 0.03 members per 100 inhabitants 17 members · 50,146 inhabitants 1 register locationsMilitsch 0.11 members per 100 inhabitants 62 members · 55,904 inhabitants 1 register locationsKroben 0.11 members per 100 inhabitants 78 members · 74,129 inhabitants 1 register locationsLiegnitz 0.44 members per 100 inhabitants 306 members · 69,008 inhabitants 2 register locationsSchonau 0.25 members per 100 inhabitants 67 members · 27,050 inhabitants 1 register locationsJauer 0.34 members per 100 inhabitants 116 members · 33,768 inhabitants 1 register locationsBolkenhain 0.18 members per 100 inhabitants 60 members · 32,678 inhabitants 1 register locationsStriegau 0.17 members per 100 inhabitants 59 members · 34,714 inhabitants 1 register locationsSchweidnitz 0.08 members per 100 inhabitants 61 members · 78,996 inhabitants 1 register locationsReichenbach 0.27 members per 100 inhabitants 172 members · 64,167 inhabitants 3 register locationsNeumarkt 0.11 members per 100 inhabitants 64 members · 56,504 inhabitants 1 register locationsNimptsch 0.17 members per 100 inhabitants 50 members · 29,533 inhabitants 1 register locationsTrebnitz 0.11 members per 100 inhabitants 56 members · 52,597 inhabitants 1 register locationsGross Wartenberg 0.16 members per 100 inhabitants 81 members · 51,200 inhabitants 2 register locationsKrotoschin 0.06 members per 100 inhabitants 37 members · 64,309 inhabitants 1 register locationsOls 0.15 members per 100 inhabitants 93 members · 62,803 inhabitants 2 register locationsMeseritz 0.15 members per 100 inhabitants 68 members · 45,715 inhabitants 2 register locationsBuk 0.06 members per 100 inhabitants 35 members · 56,686 inhabitants 1 register locationsSamter 0.05 members per 100 inhabitants 26 members · 48,747 inhabitants 1 register locationsCzarnikau 0.06 members per 100 inhabitants 43 members · 68,395 inhabitants 1 register locationsKosten 0.20 members per 100 inhabitants 128 members · 64,441 inhabitants 2 register locationsSchrimm 0.06 members per 100 inhabitants 31 members · 55,964 inhabitants 1 register locationsSchroda 0.06 members per 100 inhabitants 29 members · 47,866 inhabitants 1 register locationsObornik 0.05 members per 100 inhabitants 25 members · 47,380 inhabitants 1 register locationsChodziesen 0.08 members per 100 inhabitants 42 members · 52,805 inhabitants 1 register locationsWongrowitz 0.00 members per 100 inhabitants 0 members · 54,830 inhabitants 0 register locationsWirsitz 0.00 members per 100 inhabitants 0 members · 57,545 inhabitants 0 register locationsSchubin 0.00 members per 100 inhabitants 0 members · 56,127 inhabitants 0 register locationsBromberg 0.15 members per 100 inhabitants 136 members · 88,467 inhabitants 1 register locationsNeisse 0.19 members per 100 inhabitants 175 members · 93,223 inhabitants 2 register locationsFalkenberg 0.00 members per 100 inhabitants 0 members · 39,935 inhabitants 0 register locationsNeustadt (Oppeln) 0.06 members per 100 inhabitants 47 members · 84,660 inhabitants 1 register locationsLublinitz 0.00 members per 100 inhabitants 0 members · 45,064 inhabitants 0 register locationsLeobschutz 0.04 members per 100 inhabitants 36 members · 81,382 inhabitants 1 register locationsRatibor 0.04 members per 100 inhabitants 41 members · 111,696 inhabitants 1 register locationsRybnik 0.03 members per 100 inhabitants 23 members · 71,180 inhabitants 1 register locationsBeuthen 0.29 members per 100 inhabitants 559 members · 192,390 inhabitants 7 register locationsPless 0.04 members per 100 inhabitants 35 members · 85,236 inhabitants 1 register locationsGrottkau 0.18 members per 100 inhabitants 82 members · 44,555 inhabitants 1 register locationsGross Strehlitz 0.00 members per 100 inhabitants 0 members · 60,003 inhabitants 0 register locationsKosel 0.00 members per 100 inhabitants 0 members · 63,600 inhabitants 0 register locationsTost-Gleiwitz 0.14 members per 100 inhabitants 113 members · 81,850 inhabitants 1 register locationsHeiligenstadt 0.17 members per 100 inhabitants 67 members · 39,794 inhabitants 1 register locationsEschwege 0.55 members per 100 inhabitants 225 members · 40,844 inhabitants 2 register locationsWorbis 0.00 members per 100 inhabitants 0 members · 41,590 inhabitants 0 register locationsMuhlhausen 0.50 members per 100 inhabitants 247 members · 48,988 inhabitants 2 register locationsLangensalza 0.50 members per 100 inhabitants 174 members · 34,772 inhabitants 3 register locationsWeissensee 0.18 members per 100 inhabitants 50 members · 27,285 inhabitants 1 register locationsEckartsberga 0.32 members per 100 inhabitants 125 members · 39,660 inhabitants 2 register locationsNaumburg 0.88 members per 100 inhabitants 230 members · 26,057 inhabitants 3 register locationsWeissenfels 0.86 members per 100 inhabitants 545 members · 63,567 inhabitants 5 register locationsZeitz 0.55 members per 100 inhabitants 222 members · 40,375 inhabitants 1 register locationsSangerhausen 0.28 members per 100 inhabitants 188 members · 66,792 inhabitants 2 register locationsQuerfurt 0.51 members per 100 inhabitants 265 members · 52,190 inhabitants 5 register locationsMansfelder Seekreis 0.51 members per 100 inhabitants 318 members · 62,956 inhabitants 3 register locationsDelitzsch 0.64 members per 100 inhabitants 371 members · 57,835 inhabitants 3 register locationsTorgau 0.61 members per 100 inhabitants 346 members · 56,578 inhabitants 4 register locationsWernigerode 0.32 members per 100 inhabitants 70 members · 21,566 inhabitants 1 register locationsHalberstadt 0.40 members per 100 inhabitants 232 members · 58,119 inhabitants 3 register locationsAschersleben 0.24 members per 100 inhabitants 150 members · 61,450 inhabitants 2 register locationsOschersleben 0.16 members per 100 inhabitants 72 members · 44,096 inhabitants 1 register locationsSalzwedel 0.11 members per 100 inhabitants 56 members · 49,837 inhabitants 1 register locationsWanzleben 0.16 members per 100 inhabitants 100 members · 63,382 inhabitants 1 register locationsWittenberg 0.36 members per 100 inhabitants 187 members · 51,779 inhabitants 1 register locationsLiebenwerda 0.54 members per 100 inhabitants 235 members · 43,319 inhabitants 4 register locationsSchweinitz 0.39 members per 100 inhabitants 159 members · 40,818 inhabitants 2 register locationsWolmirstedt 0.20 members per 100 inhabitants 97 members · 48,076 inhabitants 3 register locationsStendal 0.48 members per 100 inhabitants 231 members · 47,637 inhabitants 3 register locationsOsterburg 0.39 members per 100 inhabitants 179 members · 45,744 inhabitants 3 register locationsJerichow Ii 0.26 members per 100 inhabitants 136 members · 53,324 inhabitants 2 register locationsMagdeburg (urban) 0.73 members per 100 inhabitants 760 members · 104,122 inhabitants 3 register locationsHadersleben · Schleswig–Holstein 0.00 members per 100 inhabitants 0 members · 59,862 inhabitants 0 register locationsApenrade · Schleswig–Holstein 0.00 members per 100 inhabitants 0 members · 29,264 inhabitants 0 register locationsFlensburg · Schleswig–Holstein 0.15 members per 100 inhabitants 93 members · 62,594 inhabitants 1 register locationsEiderstedt · Schleswig–Holstein 0.36 members per 100 inhabitants 64 members · 17,937 inhabitants 1 register locationsNorderdithmarschen · Schleswig–Holstein 0.47 members per 100 inhabitants 163 members · 34,704 inhabitants 2 register locationsPlon · Schleswig–Holstein 0.41 members per 100 inhabitants 206 members · 50,213 inhabitants 3 register locationsSuderdithmarschen · Schleswig–Holstein 0.10 members per 100 inhabitants 40 members · 39,485 inhabitants 1 register locationsSteinburg · Schleswig–Holstein 0.40 members per 100 inhabitants 245 members · 60,841 inhabitants 3 register locationsEckernforde · Schleswig–Holstein 0.12 members per 100 inhabitants 54 members · 45,093 inhabitants 1 register locationsSchleswig · Schleswig–Holstein 0.39 members per 100 inhabitants 236 members · 60,270 inhabitants 2 register locationsRendsburg · Schleswig–Holstein 0.41 members per 100 inhabitants 183 members · 44,236 inhabitants 2 register locationsKiel · Schleswig–Holstein 0.57 members per 100 inhabitants 358 members · 62,316 inhabitants 2 register locationsSegeberg · Schleswig–Holstein 0.41 members per 100 inhabitants 177 members · 42,658 inhabitants 3 register locationsPinneberg · Schleswig–Holstein 0.51 members per 100 inhabitants 301 members · 58,492 inhabitants 4 register locationsHarburg 0.61 members per 100 inhabitants 410 members · 67,227 inhabitants 2 register locationsRotenburg (Stade) 0.48 members per 100 inhabitants 152 members · 31,795 inhabitants 2 register locationsStader Marschkreis 0.07 members per 100 inhabitants 28 members · 38,122 inhabitants 1 register locationsNeuhaus 0.08 members per 100 inhabitants 24 members · 28,308 inhabitants 1 register locationsStader Geestkreis 1.11 members per 100 inhabitants 583 members · 52,400 inhabitants 9 register locationsHadeln 0.00 members per 100 inhabitants 0 members · 17,439 inhabitants 0 register locationsLehe 0.49 members per 100 inhabitants 243 members · 49,697 inhabitants 5 register locationsOsterholz 0.69 members per 100 inhabitants 291 members · 42,438 inhabitants 6 register locationsLuneburg 1.23 members per 100 inhabitants 585 members · 47,504 inhabitants 3 register locationsVerden 0.80 members per 100 inhabitants 330 members · 41,208 inhabitants 4 register locationsUlzen 0.61 members per 100 inhabitants 269 members · 43,998 inhabitants 4 register locationsMarienburg (Hildesheim) 0.40 members per 100 inhabitants 214 members · 53,706 inhabitants 5 register locationsHannover (rural) 0.16 members per 100 inhabitants 104 members · 66,534 inhabitants 2 register locationsDiepholz 0.16 members per 100 inhabitants 82 members · 50,928 inhabitants 2 register locationsHoya 0.14 members per 100 inhabitants 63 members · 46,366 inhabitants 2 register locationsEinbeck 0.46 members per 100 inhabitants 305 members · 66,958 inhabitants 4 register locationsOsterode Am Harz 0.70 members per 100 inhabitants 456 members · 65,553 inhabitants 4 register locationsAltona (urban) · Schleswig–Holstein 0.42 members per 100 inhabitants 319 members · 75,309 inhabitants 1 register locationsLubbecke 0.00 members per 100 inhabitants 0 members · 49,022 inhabitants 0 register locationsNienburg 0.45 members per 100 inhabitants 232 members · 51,856 inhabitants 3 register locationsSpringe 0.37 members per 100 inhabitants 171 members · 45,745 inhabitants 5 register locationsGifhorn 0.01 members per 100 inhabitants 5 members · 51,505 inhabitants 2 register locationsDannenberg 0.51 members per 100 inhabitants 286 members · 55,704 inhabitants 5 register locationsFallingbostel 0.25 members per 100 inhabitants 129 members · 51,170 inhabitants 3 register locationsCelle 0.32 members per 100 inhabitants 205 members · 64,604 inhabitants 3 register locationsGottingen 0.91 members per 100 inhabitants 605 members · 66,550 inhabitants 4 register locationsHannover (urban) 1.39 members per 100 inhabitants 1,027 members · 73,979 inhabitants 1 register locationsBersenbruck 0.00 members per 100 inhabitants 0 members · 42,727 inhabitants 1 register locationsMeppen 0.00 members per 100 inhabitants 0 members · 55,189 inhabitants 0 register locationsLeer 0.20 members per 100 inhabitants 127 members · 63,565 inhabitants 1 register locationsLingen 0.16 members per 100 inhabitants 95 members · 58,551 inhabitants 2 register locationsHerford 0.46 members per 100 inhabitants 319 members · 69,307 inhabitants 2 register locationsBielefeld 0.49 members per 100 inhabitants 272 members · 55,812 inhabitants 1 register locationsAhaus 0.00 members per 100 inhabitants 0 members · 37,384 inhabitants 0 register locationsPaderborn 0.22 members per 100 inhabitants 86 members · 39,700 inhabitants 1 register locationsWarburg 0.00 members per 100 inhabitants 0 members · 31,465 inhabitants 0 register locationsBorken 0.00 members per 100 inhabitants 0 members · 41,086 inhabitants 0 register locationsRecklinghausen 0.10 members per 100 inhabitants 51 members · 51,085 inhabitants 1 register locationsBuren 0.00 members per 100 inhabitants 0 members · 36,443 inhabitants 0 register locationsBrilon 0.00 members per 100 inhabitants 0 members · 36,660 inhabitants 0 register locationsBiedenkopf 0.33 members per 100 inhabitants 125 members · 38,416 inhabitants 2 register locationsWittgenstein 0.33 members per 100 inhabitants 70 members · 21,285 inhabitants 1 register locationsBochum 0.52 members per 100 inhabitants 603 members · 115,782 inhabitants 4 register locationsHagen 0.55 members per 100 inhabitants 559 members · 102,250 inhabitants 6 register locationsMarburg 0.36 members per 100 inhabitants 142 members · 39,089 inhabitants 2 register locationsWolfhagen 0.36 members per 100 inhabitants 90 members · 24,712 inhabitants 2 register locationsRotenburg (Kassel) 0.16 members per 100 inhabitants 50 members · 31,242 inhabitants 1 register locationsHofgeismar 0.72 members per 100 inhabitants 261 members · 36,385 inhabitants 4 register locationsWitzenhausen 0.36 members per 100 inhabitants 113 members · 31,786 inhabitants 2 register locationsOsnabruck 0.41 members per 100 inhabitants 247 members · 60,499 inhabitants 1 register locationsMettmann 3.34 members per 100 inhabitants 1,761 members · 52,702 inhabitants 4 register locationsEssen 0.25 members per 100 inhabitants 274 members · 109,971 inhabitants 2 register locationsMinden 0.10 members per 100 inhabitants 73 members · 73,385 inhabitants 1 register locationsMelle 0.03 members per 100 inhabitants 15 members · 47,509 inhabitants 1 register locationsTecklenburg 0.12 members per 100 inhabitants 58 members · 46,432 inhabitants 1 register locationsHalle 0.00 members per 100 inhabitants 0 members · 29,297 inhabitants 0 register locationsWarendorf 0.00 members per 100 inhabitants 0 members · 28,798 inhabitants 0 register locationsSteinfurt 0.15 members per 100 inhabitants 69 members · 44,555 inhabitants 1 register locationsWiedenbruck 0.31 members per 100 inhabitants 133 members · 42,265 inhabitants 3 register locationsKoesfeld 0.00 members per 100 inhabitants 0 members · 41,455 inhabitants 0 register locationsLudinghausen 0.00 members per 100 inhabitants 0 members · 39,203 inhabitants 0 register locationsBeckum 0.00 members per 100 inhabitants 0 members · 38,856 inhabitants 0 register locationsDortmund 0.64 members per 100 inhabitants 715 members · 112,178 inhabitants 5 register locationsHamm 0.73 members per 100 inhabitants 423 members · 58,051 inhabitants 4 register locationsSoest 0.29 members per 100 inhabitants 142 members · 49,207 inhabitants 1 register locationsLippstadt 0.56 members per 100 inhabitants 198 members · 35,449 inhabitants 2 register locationsArnsberg 0.28 members per 100 inhabitants 103 members · 36,502 inhabitants 1 register locationsIserlohn 0.60 members per 100 inhabitants 310 members · 51,396 inhabitants 2 register locationsAltena 0.42 members per 100 inhabitants 223 members · 53,262 inhabitants 4 register locationsMeschede 0.00 members per 100 inhabitants 0 members · 32,796 inhabitants 0 register locationsOlpe 0.14 members per 100 inhabitants 44 members · 30,372 inhabitants 1 register locationsSiegen 0.25 members per 100 inhabitants 142 members · 56,171 inhabitants 1 register locationsFritzlar 0.31 members per 100 inhabitants 81 members · 26,340 inhabitants 2 register locationsHomberg 0.37 members per 100 inhabitants 82 members · 22,224 inhabitants 1 register locationsMelsungen 0.71 members per 100 inhabitants 200 members · 28,118 inhabitants 3 register locationsKleve 0.00 members per 100 inhabitants 0 members · 48,800 inhabitants 0 register locationsGeldern 0.29 members per 100 inhabitants 146 members · 49,596 inhabitants 1 register locationsKempen 0.28 members per 100 inhabitants 221 members · 79,198 inhabitants 4 register locationsGladbach 0.44 members per 100 inhabitants 403 members · 91,295 inhabitants 3 register locationsLennep 0.62 members per 100 inhabitants 492 members · 79,846 inhabitants 6 register locationsWipperfurth 0.00 members per 100 inhabitants 0 members · 27,910 inhabitants 0 register locationsWaldbrol 0.00 members per 100 inhabitants 0 members · 21,223 inhabitants 0 register locationsAltenkirchen 0.08 members per 100 inhabitants 36 members · 45,803 inhabitants 1 register locationsKochem 0.00 members per 100 inhabitants 0 members · 35,512 inhabitants 0 register locationsWittlich 0.00 members per 100 inhabitants 0 members · 37,505 inhabitants 0 register locationsSimmern 0.00 members per 100 inhabitants 0 members · 37,322 inhabitants 0 register locationsMeisenheim 0.00 members per 100 inhabitants 0 members · 13,586 inhabitants 0 register locationsKreuznach 0.19 members per 100 inhabitants 114 members · 59,759 inhabitants 1 register locationsOberwesterwaldkreis 0.00 members per 100 inhabitants 0 members · 35,906 inhabitants 0 register locationsWiesbaden (rural) 0.77 members per 100 inhabitants 419 members · 54,426 inhabitants 11 register locationsFrankfurt am Main Rate unavailable Unavailable members · Unavailable inhabitants Unavailable register locations Rate unavailable: the archived map joins this county to the population for Lebus–Frankfurt (Oder), and the later analysis dataset changes its membership count. No value has been inferred.Hanau 1.21 members per 100 inhabitants 761 members · 62,984 inhabitants 7 register locationsGelnhausen 0.15 members per 100 inhabitants 61 members · 40,749 inhabitants 1 register locationsSchluchtern 0.22 members per 100 inhabitants 70 members · 31,774 inhabitants 1 register locationsFulda 0.25 members per 100 inhabitants 115 members · 46,608 inhabitants 1 register locationsHunfeld 0.23 members per 100 inhabitants 58 members · 25,640 inhabitants 1 register locationsZiegenhain 0.17 members per 100 inhabitants 57 members · 33,528 inhabitants 1 register locationsHersfeld 0.25 members per 100 inhabitants 86 members · 34,372 inhabitants 1 register locationsSchleusingen 0.53 members per 100 inhabitants 198 members · 37,628 inhabitants 3 register locationsElberfeld (urban) 0.00 members per 100 inhabitants 0 members · 65,321 inhabitants 0 register locationsGummersbach 0.45 members per 100 inhabitants 132 members · 29,537 inhabitants 2 register locationsBarmen (urban) 0.00 members per 100 inhabitants 0 members · 64,945 inhabitants 0 register locationsSchaumburg 0.38 members per 100 inhabitants 143 members · 37,503 inhabitants 2 register locationsRees 0.28 members per 100 inhabitants 169 members · 59,355 inhabitants 2 register locationsMors 0.22 members per 100 inhabitants 129 members · 59,173 inhabitants 3 register locationsDuisburg 3.39 members per 100 inhabitants 872 members · 25,757 inhabitants 4 register locationsKrefeld 0.62 members per 100 inhabitants 507 members · 81,186 inhabitants 1 register locationsDusseldorf 0.11 members per 100 inhabitants 122 members · 108,988 inhabitants 1 register locationsNeuss 0.26 members per 100 inhabitants 112 members · 42,818 inhabitants 1 register locationsGrevenbroich 0.11 members per 100 inhabitants 44 members · 39,176 inhabitants 1 register locationsSolingen 0.42 members per 100 inhabitants 370 members · 88,954 inhabitants 3 register locationsMulheim 0.00 members per 100 inhabitants 0 members · 151,207 inhabitants 0 register locationsSiegkreis 0.10 members per 100 inhabitants 80 members · 83,144 inhabitants 1 register locationsNeuwied 0.12 members per 100 inhabitants 80 members · 67,717 inhabitants 1 register locationsAhrweiler 0.00 members per 100 inhabitants 0 members · 34,012 inhabitants 0 register locationsAdenau 0.25 members per 100 inhabitants 56 members · 22,135 inhabitants 1 register locationsMayen 0.00 members per 100 inhabitants 0 members · 54,788 inhabitants 0 register locationsKoblenz 0.23 members per 100 inhabitants 166 members · 73,738 inhabitants 3 register locationsUnterwesterwaldkreis 0.18 members per 100 inhabitants 91 members · 51,678 inhabitants 3 register locationsSankt Goar 0.00 members per 100 inhabitants 0 members · 37,325 inhabitants 0 register locationsDillkreis 0.65 members per 100 inhabitants 228 members · 35,048 inhabitants 4 register locationsOberlahnkreis 0.09 members per 100 inhabitants 51 members · 57,561 inhabitants 1 register locationsUntertaunuskreis 0.15 members per 100 inhabitants 64 members · 42,295 inhabitants 2 register locationsWiesbaden (urban) 0.89 members per 100 inhabitants 267 members · 30,085 inhabitants 1 register locationsBergheim 0.00 members per 100 inhabitants 0 members · 40,492 inhabitants 0 register locationsErkelenz 0.18 members per 100 inhabitants 71 members · 39,786 inhabitants 1 register locationsHeinsberg 0.00 members per 100 inhabitants 0 members · 35,992 inhabitants 0 register locationsGeilenkirchen 0.00 members per 100 inhabitants 0 members · 26,315 inhabitants 0 register locationsJulich 0.00 members per 100 inhabitants 0 members · 42,105 inhabitants 0 register locationsBonn 0.44 members per 100 inhabitants 288 members · 65,795 inhabitants 1 register locationsEuskirchen 0.09 members per 100 inhabitants 34 members · 37,182 inhabitants 1 register locationsRheinbach 0.00 members per 100 inhabitants 0 members · 31,989 inhabitants 0 register locationsAachen (rural) 0.06 members per 100 inhabitants 56 members · 87,351 inhabitants 1 register locationsMalmedy 0.00 members per 100 inhabitants 0 members · 30,809 inhabitants 0 register locationsSchleiden 0.00 members per 100 inhabitants 0 members · 42,221 inhabitants 0 register locationsPrum 0.00 members per 100 inhabitants 0 members · 35,515 inhabitants 0 register locationsBitburg 0.00 members per 100 inhabitants 0 members · 44,004 inhabitants 0 register locationsBernkastel 0.00 members per 100 inhabitants 0 members · 44,146 inhabitants 0 register locationsSaarburg 0.00 members per 100 inhabitants 0 members · 29,869 inhabitants 0 register locationsMerzig 0.08 members per 100 inhabitants 28 members · 34,965 inhabitants 1 register locationsSaarlouis 0.00 members per 100 inhabitants 0 members · 59,724 inhabitants 0 register locationsSaarbrucken 0.26 members per 100 inhabitants 203 members · 79,185 inhabitants 1 register locationsOttweiler 0.42 members per 100 inhabitants 206 members · 49,140 inhabitants 3 register locationsSankt Wendel 0.45 members per 100 inhabitants 190 members · 42,511 inhabitants 2 register locationsHaigerloch 0.00 members per 100 inhabitants 0 members · 11,773 inhabitants 0 register locationsDuren 0.15 members per 100 inhabitants 94 members · 63,411 inhabitants 1 register locationsMontjoie 0.00 members per 100 inhabitants 0 members · 19,138 inhabitants 0 register locationsEupen 0.12 members per 100 inhabitants 31 members · 24,886 inhabitants 1 register locationsDaun 0.00 members per 100 inhabitants 0 members · 26,742 inhabitants 0 register locationsDeutsch Krone 0.05 members per 100 inhabitants 33 members · 63,945 inhabitants 1 register locationsTrier (urban) 0.73 members per 100 inhabitants 235 members · 32,026 inhabitants 1 register locationsBreslau (urban) 0.40 members per 100 inhabitants 740 members · 186,276 inhabitants 1 register locationsSchlochau 0.00 members per 100 inhabitants 0 members · 59,522 inhabitants 0 register locationsKonitz 0.00 members per 100 inhabitants 0 members · 67,981 inhabitants 0 register locationsFlatow 0.00 members per 100 inhabitants 0 members · 61,157 inhabitants 0 register locationsOrtelsburg 0.08 members per 100 inhabitants 48 members · 60,511 inhabitants 1 register locationsJohannisburg 0.00 members per 100 inhabitants 0 members · 43,413 inhabitants 0 register locationsOletzko 0.00 members per 100 inhabitants 0 members · 39,593 inhabitants 0 register locationsLotzen 0.00 members per 100 inhabitants 0 members · 39,014 inhabitants 0 register locationsSensburg 0.00 members per 100 inhabitants 0 members · 46,218 inhabitants 0 register locationsRastenburg 0.00 members per 100 inhabitants 0 members · 42,426 inhabitants 0 register locationsAngerburg 0.00 members per 100 inhabitants 0 members · 38,771 inhabitants 0 register locationsGoldap 0.00 members per 100 inhabitants 0 members · 44,004 inhabitants 0 register locationsGumbinnen 0.35 members per 100 inhabitants 163 members · 47,218 inhabitants 1 register locationsPillkallen 0.00 members per 100 inhabitants 0 members · 45,665 inhabitants 0 register locationsInsterburg 0.20 members per 100 inhabitants 133 members · 66,086 inhabitants 1 register locationsRagnit 0.06 members per 100 inhabitants 34 members · 53,598 inhabitants 1 register locationsNiederung 0.00 members per 100 inhabitants 0 members · 51,834 inhabitants 0 register locationsDanzig (rural) 0.00 members per 100 inhabitants 0 members · 74,919 inhabitants 0 register locationsTilsit 0.36 members per 100 inhabitants 228 members · 63,838 inhabitants 1 register locationsSchwetz 0.21 members per 100 inhabitants 147 members · 71,159 inhabitants 2 register locationsBraunsberg 0.26 members per 100 inhabitants 137 members · 52,235 inhabitants 3 register locationsLyck 0.00 members per 100 inhabitants 0 members · 45,496 inhabitants 0 register locationsStalluponen 0.12 members per 100 inhabitants 54 members · 44,463 inhabitants 1 register locationsHeydekrug 0.14 members per 100 inhabitants 54 members · 38,557 inhabitants 1 register locationsLabiau 0.28 members per 100 inhabitants 139 members · 50,467 inhabitants 1 register locationsHeiligenbeil 0.14 members per 100 inhabitants 62 members · 45,064 inhabitants 1 register locationsStrasburg 0.09 members per 100 inhabitants 53 members · 61,804 inhabitants 1 register locationsBerent 0.00 members per 100 inhabitants 0 members · 43,056 inhabitants 0 register locationsPreussisch Stargard 0.12 members per 100 inhabitants 80 members · 67,587 inhabitants 2 register locationsGraudenz 0.25 members per 100 inhabitants 145 members · 58,247 inhabitants 1 register locationsKulm 0.07 members per 100 inhabitants 38 members · 53,158 inhabitants 1 register locationsMarienwerder 0.11 members per 100 inhabitants 70 members · 66,607 inhabitants 2 register locationsMarienburg (Danzig) 0.17 members per 100 inhabitants 103 members · 59,092 inhabitants 2 register locationsPreussisch Holland 0.07 members per 100 inhabitants 30 members · 44,163 inhabitants 1 register locationsStuhm 0.00 members per 100 inhabitants 0 members · 40,483 inhabitants 0 register locationsMohrungen 0.08 members per 100 inhabitants 45 members · 56,245 inhabitants 2 register locationsRosenberg (Marienwerder) 0.00 members per 100 inhabitants 0 members · 50,805 inhabitants 0 register locationsLobau 0.10 members per 100 inhabitants 47 members · 47,888 inhabitants 1 register locationsOsterode 0.00 members per 100 inhabitants 0 members · 61,859 inhabitants 0 register locationsNeidenburg 0.00 members per 100 inhabitants 0 members · 50,340 inhabitants 0 register locationsElbing 0.19 members per 100 inhabitants 124 members · 65,115 inhabitants 1 register locationsHeilsberg 0.05 members per 100 inhabitants 27 members · 53,279 inhabitants 1 register locationsAllenstein 0.00 members per 100 inhabitants 0 members · 52,754 inhabitants 0 register locationsRossel 0.00 members per 100 inhabitants 0 members · 47,361 inhabitants 0 register locationsFriedland 0.00 members per 100 inhabitants 0 members · 44,833 inhabitants 0 register locationsPreussisch Eylau 0.09 members per 100 inhabitants 52 members · 55,874 inhabitants 1 register locationsGerdauen 0.00 members per 100 inhabitants 0 members · 38,110 inhabitants 0 register locationsDarkehmen 0.00 members per 100 inhabitants 0 members · 37,010 inhabitants 0 register locationsWehlau 0.22 members per 100 inhabitants 109 members · 49,207 inhabitants 2 register locationsThorn 0.17 members per 100 inhabitants 109 members · 64,864 inhabitants 1 register locationsDanzig (urban) 0.38 members per 100 inhabitants 335 members · 89,311 inhabitants 2 register locationsKarthaus 0.00 members per 100 inhabitants 0 members · 55,924 inhabitants 0 register locationsPotsdam (urban) 0.35 members per 100 inhabitants 151 members · 42,863 inhabitants 1 register locationsPosen (urban) 0.49 members per 100 inhabitants 263 members · 53,392 inhabitants 2 register locationsKoln (urban) 0.30 members per 100 inhabitants 377 members · 125,172 inhabitants 1 register locationsKönigsberg (urban) 0.84 members per 100 inhabitants 897 members · 106,296 inhabitants 1 register locationsHalle (urban) 0.30 members per 100 inhabitants 147 members · 48,946 inhabitants 1 register locationsMunster (urban) 0.71 members per 100 inhabitants 181 members · 25,453 inhabitants 1 register locationsKassel (urban) 0.00 members per 100 inhabitants 0 members · 41,587 inhabitants 0 register locationsAachen (urban) 0.55 members per 100 inhabitants 374 members · 68,178 inhabitants 2 register locationsDemmin 0.39 members per 100 inhabitants 187 members · 48,285 inhabitants 3 register locationsFranzburg 0.47 members per 100 inhabitants 351 members · 74,028 inhabitants 4 register locationsSchlawe 0.15 members per 100 inhabitants 118 members · 78,908 inhabitants 2 register locationsStolp 0.12 members per 100 inhabitants 107 members · 90,355 inhabitants 1 register locationsRandow 0.27 members per 100 inhabitants 233 members · 87,665 inhabitants 4 register locationsSchivelbein 0.44 members per 100 inhabitants 87 members · 19,623 inhabitants 1 register locationsRummelsburg 0.12 members per 100 inhabitants 39 members · 32,114 inhabitants 1 register locationsBreslau (rural) 0.00 members per 100 inhabitants 0 members · 64,333 inhabitants 0 register locationsPosen (rural) 0.00 members per 100 inhabitants 0 members · 52,570 inhabitants 0 register locationsNordhausen 0.32 members per 100 inhabitants 199 members · 62,752 inhabitants 1 register locationsErfurt 0.46 members per 100 inhabitants 285 members · 62,401 inhabitants 1 register locationsMerseburg 0.61 members per 100 inhabitants 388 members · 63,522 inhabitants 4 register locationsMansfelder Gebirgskr 0.19 members per 100 inhabitants 80 members · 42,235 inhabitants 1 register locationsSaalkreis 0.27 members per 100 inhabitants 162 members · 59,380 inhabitants 3 register locationsBitterfeld 0.55 members per 100 inhabitants 270 members · 48,844 inhabitants 4 register locationsNeuhaldensleben 0.22 members per 100 inhabitants 106 members · 49,012 inhabitants 1 register locationsGardelegen 0.26 members per 100 inhabitants 128 members · 49,564 inhabitants 3 register locationsKalbe 0.59 members per 100 inhabitants 428 members · 72,186 inhabitants 5 register locationsJerichow I 0.25 members per 100 inhabitants 159 members · 64,126 inhabitants 1 register locationsTondern · Schleswig–Holstein 0.00 members per 100 inhabitants 0 members · 58,903 inhabitants 0 register locationsSonderburg · Schleswig–Holstein 0.00 members per 100 inhabitants 0 members · 34,551 inhabitants 0 register locationsHusum · Schleswig–Holstein 0.66 members per 100 inhabitants 237 members · 35,753 inhabitants 2 register locationsOldenburg · Schleswig–Holstein 0.23 members per 100 inhabitants 109 members · 46,956 inhabitants 2 register locationsStormarn · Schleswig–Holstein 0.22 members per 100 inhabitants 139 members · 62,281 inhabitants 2 register locationsHildesheim 0.71 members per 100 inhabitants 432 members · 60,521 inhabitants 3 register locationsGoslar 0.62 members per 100 inhabitants 324 members · 52,112 inhabitants 4 register locationsZellerfeld 1.38 members per 100 inhabitants 620 members · 44,810 inhabitants 8 register locationsEmden 0.56 members per 100 inhabitants 340 members · 60,917 inhabitants 3 register locationsAurich 0.19 members per 100 inhabitants 134 members · 69,394 inhabitants 5 register locationsHoxter 0.21 members per 100 inhabitants 104 members · 50,456 inhabitants 2 register locationsKirchhain 0.74 members per 100 inhabitants 173 members · 23,223 inhabitants 4 register locationsFrankenberg 0.16 members per 100 inhabitants 40 members · 24,411 inhabitants 2 register locationsMunster (rural) 0.00 members per 100 inhabitants 0 members · 44,906 inhabitants 0 register locationsKassel (rural) 2.13 members per 100 inhabitants 788 members · 36,936 inhabitants 1 register locationsKoln (rural) 0.00 members per 100 inhabitants 0 members · 79,663 inhabitants 0 register locationsWetzlar 0.50 members per 100 inhabitants 223 members · 44,867 inhabitants 2 register locationsSchmalkalden 0.42 members per 100 inhabitants 118 members · 28,204 inhabitants 1 register locationsRheingaukreis 0.48 members per 100 inhabitants 259 members · 54,434 inhabitants 9 register locationsObertaunuskreis 0.51 members per 100 inhabitants 266 members · 52,495 inhabitants 7 register locationsZell 0.19 members per 100 inhabitants 57 members · 29,318 inhabitants 1 register locationsUnterlahnkreis 0.53 members per 100 inhabitants 353 members · 66,032 inhabitants 5 register locationsTrier (rural) 0.00 members per 100 inhabitants 0 members · 63,557 inhabitants 0 register locationsHechingen 0.21 members per 100 inhabitants 41 members · 19,832 inhabitants 1 register locationsSigmaringen 0.31 members per 100 inhabitants 61 members · 19,679 inhabitants 1 register locationsFischhausen 0.00 members per 100 inhabitants 0 members · 47,119 inhabitants 0 register locationsKönigsberg (rural) 0.00 members per 100 inhabitants 0 members · 48,789 inhabitants 0 register locationsNeustadt (Danzig) 0.23 members per 100 inhabitants 137 members · 60,218 inhabitants 1 register locationsMemel 0.66 members per 100 inhabitants 373 members · 56,408 inhabitants 1 register locationsUsedom-Wollin 0.19 members per 100 inhabitants 81 members · 42,453 inhabitants 1 register locationsRugen 0.77 members per 100 inhabitants 361 members · 47,048 inhabitants 5 register locationsZiegenruck 0.32 members per 100 inhabitants 48 members · 14,862 inhabitants 1 register locationsHameln 0.49 members per 100 inhabitants 242 members · 49,452 inhabitants 4 register locationsGammertingen 0.00 members per 100 inhabitants 0 members · 13,348 inhabitants 0 register locations

Flensburg

0.15

members per 100 inhabitants

Members · 1865
93
Population · 1867
62,594
Register locations
1

Members per 100 inhabitants

00–0.100.10–0.250.25–0.500.50–1Over 1

Schleswig–Holstein outlined in ochre

Grey: rate unavailable

Gymnastics club members in 1865 per 100 inhabitants in 1867. Historical county boundaries, rebuilt from the original research data. Hover or tap a county to see its values.
Map sources & data

Digitised club register: Hirth’s 1865 Zweites statistisches Jahrbuch der Turnvereine Deutschlands, by Johannes Buggle and Rasmus Fonnesbæk Andersen. Boundaries: MPIDR Historical GIS Collection, 1867. Population: iPEHD, joined in the research archive. The map is descriptive; the estimates below come from the dissertation.

437 of 438 county rates are available. Frankfurt am Main is shown without a rate because its archived records contain conflicting county joins and membership counts. Zero means zero recorded members. Neighbouring German states provide geographic context without a matched rate.

Download county values (CSV) ↗
The 1865 gymnastics clubs: data and estimates

With Johannes Buggle I digitised the 1865 register of every German gymnastics club, 1,697 towns in all, 32 of them in Schleswig and Holstein. Gymnastics clubs were the great associations of nineteenth-century Germany, and membership is a rough measure of how much people organised together at the moment Danish rule ended. This evidence is in the dissertation chapter, not the journal article.

Across 438 Prussian counties, the former Danish duchies had no more members per head than comparable counties. With all controls the estimated difference is +0.01 members per 100 inhabitants (standard error 0.06). Seven of eight specifications include zero; the one that controls for the Protestant share of the population is negative (−0.11, standard error 0.05). On this measure, Danish rule left no associational advantage.

Part 5 · The second evidence

Today, trust shows no consistent trace of the old border

Turnout is only a proxy for the question I started with, which is about trust itself, and for that we need the survey interviewer again. Six rounds of the European Social Survey, from 2002 to 2012, include 850 respondents living in the former Danish duchies and 460 in North Schleswig. That is enough to compare each group with its neighbours on the other side of the old line, in the same country.

For Germany I matched each constituency to the 1864 map and measured how much of it the Danish crown had ruled: 1.1% of Schwerin-Ludwigslust, 50.4% of Lübeck, 100% of all eight Schleswig constituencies. In Denmark the survey records the municipality. The models hold constant age, sex, education, income, religion, minority and migrant background, and the survey round.

The national gap, and the gap at the old border

Difference in trust on 0 to 10 scales, with 95% intervals

−0.50+0.5+1+1.5+2Denmark minus Germany+1.72Former duchies (in Germany)Social trust−0.06Political trust−0.05Institutional trust+0.10North Schleswig (in Denmark)Social trust−0.14Political trust−0.14Institutional trust+0.03North Schleswig: about one twelfthof the national gap,and not distinct from zero

European Social Survey 2002 to 2012. National difference: the single social trust question, with individual controls (published Table 2). Border estimates: social, political and institutional trust indices, each 0 to 10, against neighbouring areas in the same country (published Table 3). 95% intervals computed here as ±1.96 reported standard errors.

The national gap

Start with the gap between the two countries: 1.72 points on the social trust question, measured precisely.

If that gap were an inheritance from Danish or German rule before 1920, some of it should still separate the regions that changed hands.

Former duchies

Inside Germany, the former Danish duchies are no more trusting than Hamburg, Lower Saxony and Bremen. The estimates are −0.06 for social trust, −0.05 for political trust and +0.10 for institutional trust. All three intervals include zero.

North Schleswig

Inside Denmark, North Schleswig is −0.14 points behind its neighbours on social trust, −0.14 on political trust and +0.03 on institutional trust. Again, every interval includes zero.

At true scale

On the same axis as the national gap, the largest border estimate is about one twelfth of it, and none of them can be distinguished from zero.

These estimates do not prove the differences are exactly zero. They do make it hard to believe that most of the national gap comes from rule before 1920.

Part 6 · The generations

Only the oldest still carry it

An average over everyone can hide a difference among some. If German rule left a mark on North Schleswig, it should be clearest among people born soon after 1920, whose parents had grown up under it, and weaker among their grandchildren. So I allowed the North Schleswig difference to change with each respondent’s year of birth.

The trust deficit in North Schleswig, by year of birth

Difference in social trust from the neighbouring Danish areas, 0 to 10 scale

−1−0.50+0.5+1Born 1920: −0.5019201940196019802000Year of birth

Line computed from the published coefficients (−0.50 for those born in 1920, +0.010 for each later year of birth). The shaded 95% interval is redrawn approximately from published Figure 6, because the covariance needed to recompute it is not reported. People surveyed in 2002 to 2012 and classified by birth year; this is not a panel.

Born in 1920

For a resident of North Schleswig born in the year of reunion, the estimated trust deficit against the neighbouring Danish areas is −0.50 points, half a point on the 0 to 10 scale.

Each decade after

The deficit shrinks by about 0.1 points for each decade between 1920 and a person’s birth.

1920 to 1950

For people born between roughly 1920 and 1950 the deficit is statistically clear. These are the cohorts that grew up closest to the German years.

After 1950

For people born later, there is no clear difference from their neighbours to the north.

These are different people surveyed at one point in time, not the same people followed through their lives. The pattern fits an early shock that fades from one generation to the next.

In the former duchies the equivalent estimates are small and imprecise, but they point the same way as the turnout evidence: a modest early advantage from Danish rule that wears off. In North Schleswig the oldest generations may still carry a remnant of the German years. It is small next to the gap between Denmark and Germany, and it is gone among people born after the middle of the twentieth century.

The 1920 German plebiscite postcard of a child holding a flag, shown again
1920 In 1920 the child holding a flag on this postcard stood for a choice about the future, and the evidence suggests the choice mattered for about two generations.

Part 7 · What it means

Danish trust is younger than it looks

Across the three pieces of evidence, both changes of rule moved political behaviour in the direction a liberal-institutions account predicts. Both effects faded within 40 to 70 years. Today, in the regions that changed hands, trust shows no consistent difference from their neighbours, apart from a remnant among the oldest people in North Schleswig.

If these border regions generalise to Denmark and Germany as a whole, then most of the very large gap in trust between the two countries cannot be a direct inheritance from rule before 1920. The direct responsibility lies with what happened after. That is a strong conclusion against accounts that explain Nordic success by a deep and durable culture of trust.

The other Nordic countries point the same way. Norway and Sweden were governed much like Denmark through the nineteenth century, and liberalised gradually as it did, so the conclusion may well extend to them. Finland is the hardest case for the deep-history view. It was ruled by Sweden, then by Russia as an autonomous grand duchy from 1809 to 1917, and in 1918 it fought a civil war that killed about 37,000 people out of a population of 3 million. Its levels of trust today are similar to those of the other Nordic countries.

None of this means history is irrelevant, since the design cannot see indirect effects. High trust and a habit of association may have made it easier for Denmark to adopt proportional representation in 1915, or to take the first steps towards a welfare state in the early 1930s; in Sweden, the early welfare state took over a great deal of work that voluntary organisations were already doing. Institutions built in one generation can carry the habits of the last into the next. What the border evidence argues against is the simplest story, in which Danes trust each other because their great-grandparents did.

This matters now because “getting to Denmark” is still the question that reformers, donors and governments in many countries ask. The pessimistic reading of Danish success is that some countries are simply blessed with a culture that others cannot copy. The evidence from this border points the other way. Within two generations, the people of Schleswig came to vote and to trust like the country they lived in. On this border, trust behaved like a habit that institutions teach, and that a new state can teach again.

56years North Schleswig spent under German rule
40–70years until turnout converged with the national average
1.72points: the Danish–German gap in social trust, 0 to 10 scale
−0.14points: North Schleswig against its neighbours today, interval includes zero

How long does history last? On this border, about two generations.
The original publication

Andersen, Rasmus Fonnesbæk (2018). “Trust in Scandinavia: Findings from Moving Borders between Denmark and Germany.” Scandinavian Political Studies 41(1): 22–48. doi:10.1111/1467-9477.12107.

Read the article at the journal ↗

Adapted from Rasmus Fonnesbæk Andersen, “Trust in Scandinavia: Findings from Moving Borders Between Denmark and Germany,” Scandinavian Political Studies 41(1), 2018, 22–48 (doi:10.1111/1467-9477.12107), sole-authored, and chapter 2 of the PhD dissertation Culture and Institutions (University of Copenhagen, 2016). Read the chapter (PDF).

How this was made. Claude (Anthropic) wrote most of the text and built the figures, working from the original and its data. Earlier drafts were made with ChatGPT (OpenAI). I reviewed all of it, and the research and its conclusions are mine. The format is inspired by Guillaume Blanc’s interactive papers, such as French and Escaping Malthus. I made these editions because most of this research has sat in a PhD dissertation and in journals for ten years, and I wanted it to be easier to read.

Every number here is listed with its source in a claim ledger kept with the website’s code, and the details are below.

Sources, methods and provenance

Published paper
Andersen, R. F. (2018). “Trust in Scandinavia.” Scandinavian Political Studies 41(1): 22–48. Checked against the December 2017 journal proof and the dissertation chapter (PDF pp. 42–77). Where the two differ, the published version is used.
Trust, 1979 to 2009
European Values Study endpoints as reported in the dissertation, Appendix A1 (PDF p. 67): Denmark 47% and 75%, West Germany 27% and 37%, 1981 and 2007. Only the endpoints are drawn. The 47% (1979) to 79% (2009) series is Sønderskov and Dinesen (2014), cited on PDF p. 43.
National gap
Published Table 2 (dissertation Table 3): Denmark minus Germany on eight trust measures, European Social Survey 2002 to 2012, individual controls, N = 21,243 to 25,809, standard errors 0.04. East minus West Germany: 0.44 (police) and 0.62 (legal system), dissertation PDF p. 57.
History
Population figures, the 1848 to 1851 war, the 27,473 signatures, school language from 1888 and the meeting houses: dissertation pp. 44 to 51 (PDF), citing Fuglsang (1920), Glenthøj (2014) and Schultz Hansen and Becker Christensen (2008). Holst’s slogan: Appendix A2. Map: Natural Earth 1:10m coastlines and today’s border; historical lines approximate.
1920 plebiscite
Official returns: Zone I, 75,431 for Denmark and 25,329 for Germany; Zone II, 51,742 for Germany and 12,800 for Denmark.
Turnout
CLEA constituency data, population weighted (PDF pp. 52 to 54). The transcription used here has 36 German and 30 Danish elections; the paper reports 37 German elections, and the missing one has not yet been reconciled with the original files. Smoothed lines (local linear, span 0.5) and the “years since the border moved” view are new presentations. Convergence after 40 to 70 years: PDF p. 61. The original plots: Germany, Denmark.
Gymnastics clubs
Dissertation evidence, not in the journal article. Dissertation Table 2 (PDF p. 56), N = 438 counties (418 with all controls). Register digitised with Johannes Buggle from the Zweites Statistisches Jahrbuch der Turnvereine Deutschlands. County values: CSV.
Trust at the border
Published Table 3, columns 17 to 19 (dissertation Table 4). Intervals computed here as ±1.96 reported standard errors. Respondents: 850 in the former duchies, 460 in North Schleswig. Refugee figures: Steinberg (1991), cited on PDF p. 60.
Generations
Published Table 3 interactions (columns 20 to 22) and Figure 6 (dissertation Figure 10). The line is computed from the coefficients; the interval is approximately redrawn from the published figure.
Images
Rosenstand’s Dybbøl painting (1894), Paul Haase’s 1920 postcard and the 10 July 1920 photograph are public domain via Wikimedia Commons. Johanne Braren is identified by Kristeligt Dagblad and the Tønder municipal archives.
Reading the figures
The text, numbers and limitations are all readable without JavaScript. Figures change as you scroll; on phones the figure stays at the top of the screen and the text scrolls up beneath it.