Where you live matters more than where you grew up.
Immigrants grow up in one political culture and then live in another. Across 36 European countries, however, the new country shapes how they take part in politics about twice as much as the old one, and their children more still.
This research began in my 2016 PhD dissertation and was published with newer data in 2022. It has not been updated since. Later events and studies appear only where marked.
Political scientists have long disagreed about whether the habits that lead people to take part in politics are set early in life and carried for good, or whether people keep learning them from those around them. Immigrants, who grow up in one political culture and then live in another, are a natural test.
Using nine rounds of the European Social Survey, from 2002 to 2018, we compare how often tens of thousands of first and second generation immigrants in 36 European countries sign petitions, join boycotts, contact officials and the like with how often the natives of their old and new countries do.
Both countries leave a mark, but the new one pulls about twice as hard. Its pull grows after twenty years of residence and is strongest in the second generation, while the old country’s pull fades. Immigrants also come to resemble the natives of their own region, which points to a simple mechanism: political habits spread through everyday contact with the people nearby.
Written largely by Claude and reviewed by me. How this was made
Original publicationPolitical Geography 98, 2022 (open access) ↗
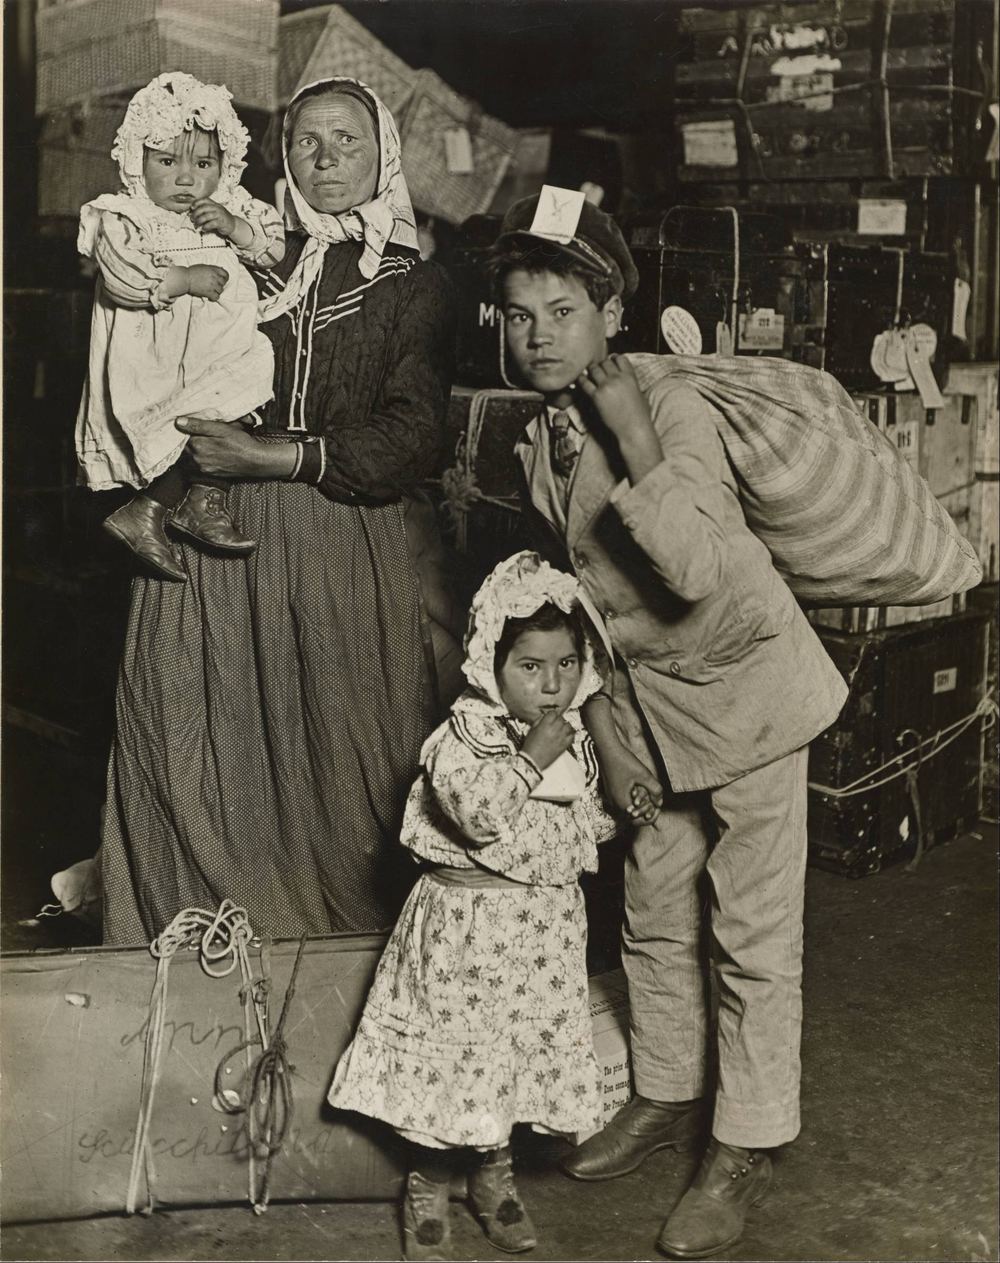

Nobody wrote down the names of the family in Lewis Hine’s photograph. They stand in the baggage room at Ellis Island in 1905, among trunks and bundles, at the start of a new life in the United States. What they carried in those bags is easy to imagine. What they carried in their heads, the habits and expectations of the place they had left, is harder to see, and that is what our paper is about.
Nearly sixty years later and an ocean away, on 10 September 1964, a 38-year-old carpenter from the village of Vale de Madeiros in Portugal, Armando Rodrigues de Sá, stepped off a special train at Köln-Deutz station. West German employers had picked him as the millionth guest worker. Officials gave him carnations, a certificate and a moped, a Zündapp Sport Combinette, which is now in the Haus der Geschichte museum in Bonn. He had grown up under António Salazar’s dictatorship and had come to work in a democracy.
Rodrigues de Sá went back to Portugal around 1970 and died there in 1979, but many others stayed. By the time West Germany stopped recruiting in 1973, about 14 million people had come to work, and about 3 million stayed for the long term. Their children grew up in Germany. Across Europe the same story has played out with other countries and other decades.
Do they keep the political habits of the country they left, or take on those of the country they live in?
That question is a sharp version of the one that runs through the dissertation this paper belongs to: are political habits an inheritance, or something that institutions and surroundings keep teaching? In the chapter on the Danish–German border, the border moved and the people stayed. Here the people move and the borders stay.
Part 1 · The question
Two old answers, and a mechanism
Political culture is the set of habits and expectations about politics that a society shares. One of its most visible parts is participation: how readily people sign, march, boycott, join and complain to those in charge. Some European countries do these things far more than others, and the differences are stable.
Students of political socialisation offer two views of how a person acquires such habits. The persistence view holds that they are laid down early, in the family and at school, and that they last. An immigrant should then go on behaving like the natives of the country where she grew up. The lifelong openness view holds that people keep updating their political habits as their experience changes. An immigrant should then drift towards the natives of the country where she now lives.
Earlier studies found evidence for both. The “civicness” of European immigrants in the United States reflects the country their families came from, across a wide range of measures including participation, and political orientations and family values persist over several generations of immigrants. At the same time, immigrants in Europe tend to participate at levels that track the natives of their new country.
When we began this work, only one study had looked at both countries at once, for first generation immigrants alone, and it found limited persistence and a stronger pull from the new country. The same pattern holds for social trust, which Peter Dinesen had studied before: in Europe, immigrants’ trust is more in line with their new country than with their old one, though some of the old persists.
We add three things:
- A much larger sample, with more countries on both sides.
- The second generation, people born in the new country to at least one parent born abroad, which gives the persistence view its hardest test.
- A test of the mechanism: whether immigrants resemble the natives of their own region.
Habits can pass down two channels. Vertically, parents hand them to their children at home. Horizontally, people pick them up from others in the wider society: teachers, colleagues, neighbours, strangers. Immigrant families make the two channels pull in different directions, because the parents carry one political culture and the society around the children carries another. Our paper is about the horizontal channel.
Most research on immigrants’ political integration works from the top down. It asks what national policies do: whether the right to vote raises participation, whether friendlier integration policies close the gap with natives, whether naturalisation makes a difference. We do not dispute any of that.
But we think it leaves out something that happens from the bottom up. Habits of participation rub off on people from the people around them, in two ways. Sometimes the pressure is explicit: people vote partly to avoid the disapproval of others. Sometimes it is quieter: people notice what their neighbours and colleagues do, down to the campaign signs in their gardens, and over time they do it too.
the slow drip of everyday life
Baybeck and McClurg (2005), quoted in the paper
If that is how political culture travels, its pull should depend on how close a person is to the people who carry it, in time and in space. We call this proximity-conditioned social diffusion. It makes four predictions that the data can check:
- The new country should pull harder on the second generation than on the first.
- Among the first generation, it should pull harder the longer someone has lived there.
- The old country should fade along the same lines.
- Within a country, immigrants should resemble the natives of their own region more than natives elsewhere.
Part 2 · How a habit becomes data
Seven things people do between elections
The European Social Survey interviews a fresh random sample of adults in each participating country roughly every two years. It is one of the few cross-national surveys that asks not only whether someone was born abroad but in which country, and, from the second round on, where their parents were born. That lets us link every immigrant to an ancestral country and a destination country.
Seven things people do between elections
Asked of every respondent about the past twelve months. The ticks show one illustrative person
Question wording: published article, section 5.4. The ticked person is illustrative; the scale is the share of the seven activities a respondent reports.
Every respondent is asked whether, in the past twelve months, they did each of seven things, from contacting an official to boycotting a product.
The score is the share they did. Someone who signed a petition and boycotted a product scores 0.29.
Voting is the most common act of all, and it is left out on purpose. Whether an immigrant may vote depends on citizenship rules that differ greatly across Europe, so a vote would measure the law as much as the person.
The seven items hang together reasonably well: the reliability score, Cronbach’s alpha, is 0.67 for the first generation and 0.66 for the second.
A country’s participation culture is the average score of its natives, people born there to two parents also born there.
Among the destination countries in the study it runs from 0.03 in Bulgaria to 0.33 in Iceland.
These averages behave like culture rather than weather. Across countries, natives’ averages in the first round, 2002, and the ninth, 2018, correlate at 0.90, and the typical country’s score moved by just 0.025.
That matters because we cannot measure the old country at the moment each person left it. A stable measure makes the gap tolerable.
Each immigrant now carries two numbers: the natives’ average in the country of origin and in the country of residence. Second generation immigrants are given their parents’ country, or the average of two.
The main sample has 38,393 people in 36 countries, from 42 countries of origin. Adding World Values Survey data for origins outside Europe extends it to 218 countries of origin and 55,473 people.
The question is then how closely, across all these people, an immigrant’s own participation follows each of the two numbers. If the persistence view is right, the old country’s average should predict best. If the lifelong openness view is right, the new country’s should. The models hold constant sex, age, education, income, unemployment and citizenship, so that differences in who migrates where do not drive the comparison.
Countries that no longer exist
Some respondents name a country of origin that has since dissolved, such as the Soviet Union, Yugoslavia, Czechoslovakia or East Germany. In the dissertation version of the paper, we describe how their old country’s average is built from the present-day countries that succeeded it. People whose “migration” consisted of a border moving around them, from Czechoslovakia to what is now the Czech Republic, say, are left out, so that redrawn borders are not mistaken for migration.
That other case, people who stay while the border moves, is the subject of the chapter on the Danish–German border.
Part 3 · The main result
The new country pulls about twice as hard
How closely immigrants track each country’s natives
Slope of immigrants’ participation on natives’ average participation, with 95% intervals
Published Table 2, Model 1a: 38,393 first and second generation immigrants, 36 destination and 42 ancestral countries, with individual controls and survey round. 95% intervals computed here as ±1.96 reported standard errors. Associations, not causal effects.
Start with the ancestral country. The slope is 0.375: a 0.1 higher native average in the country of origin goes with about 0.04 more participation among its emigrants. The interval sits well above zero, so the old country does leave a real mark.
The destination country’s slope is 0.755, with a narrower interval. A 0.1 higher native average where immigrants live goes with about 0.08 more participation.
The new country’s natives predict immigrants’ behaviour about twice as well as the old country’s.
In everyday terms, compare immigrants living in the least participatory destination country, Bulgaria, with those in the most, Iceland. The predicted difference is 0.23 on the scale, more than a standard deviation and about one and a half extra activities a year.
Coming from Iceland rather than Bulgaria predicts about 0.11. For comparison, going from less than secondary schooling to a university degree predicts about 0.10. No individual characteristic in the model comes close to the new country.
Both views of socialisation get something right. The old country persists, with a slope far from zero, but the new country dominates. That is the first answer to the question in the title. Immigrants do unpack, at least in part, and the habits they take up are those of the people around them.
The result also runs in both directions. Adaptation is not the same as becoming more active. An immigrant who settles in a country where few people sign petitions or join boycotts is predicted to do less of these things too. The habits that rub off are whatever habits the neighbours have.
Part 4 · Time, counted in generations
Their children belong to the new country
If political habits spread through contact, time spent among the natives should matter. The cleanest measure of time is the generation. A first generation immigrant arrived from abroad, often as an adult. A second generation immigrant was born in the new country and grew up there, among its schools, workplaces and neighbours, with at least one parent from somewhere else.
Two generations, two pulls
Slope of immigrants’ participation on natives’ average participation in each country
Published Table 2, Model 1b. First generation: 95% intervals computed here as ±1.96 reported standard errors. Second generation slopes add the published interaction terms; the paper does not report what is needed to draw intervals around them.
Among people who arrived from abroad, the two pulls are close: 0.604 for the new country and 0.523 for the old.
On arrival, both countries leave a mark of similar size.
Among their children, the new country’s slope rises to 0.957, close to one for one. The old country’s falls to 0.168.
Adoption of the new country’s culture is around 60 percent stronger in the second generation, and retention of the old country’s is around 70 percent weaker.
Both changes are statistically clear, and both run in the direction that longer exposure to the new country would predict.
The symmetry is the striking part. The children of immigrants do not simply add the new country’s habits on top of their parents’. They take on one and let go of the other, in roughly equal measure. The parents’ country still matters a little, which fits a family passing on some of its habits at home. But the participation of the second generation is set mostly by the people they grew up among. Where the two channels compete, the horizontal one wins.
A generation is a blunt measure, since it mixes time in the country with having been to school there and with everything else about growing up somewhere. So we looked at time directly, among the first generation.
Part 5 · Time, counted in years
Twenty years tips the balance
The survey asks first generation immigrants how long they have lived in their current country. We split them at twenty years, a coarse division, but one that separates people who arrived recently from people who have spent a large part of their adult lives in the new country.
First generation immigrants, by years in the country
Slope of immigrants’ participation on natives’ average participation in each country
Published Table 3, Model 2b: 20,050 first generation immigrants. Slopes after twenty years add the published interaction terms. 95% intervals computed here as ±1.96 reported standard errors.
Among immigrants in the country for twenty years or less, the two slopes are roughly parallel: 0.496 for the new country and 0.615 for the old. If anything, the old country still has the edge.
After twenty years the new country’s slope is 0.688 and the old country’s 0.439, so the lines have crossed.
The rise in the new country’s pull, +0.192, is about 40 percent and statistically clear.
The fall in the old country’s, −0.176, is about as large but less precise: its interval just includes zero (p = 0.10), so we read it as tentative.
Put the pieces side by side: recent arrivals, long residents, then the children of immigrants. The new country’s pull climbs at each stage and the old country’s falls.
These come from two models with different samples, so they are not one smooth line, but they tell the same story.
As we put it, immigrants come to adopt the participatory culture of their new country and lose that of their ancestral country “through a symmetrical temporal process”, and it is gradual. For the first twenty years the old country holds its own. The shift becomes clear over decades, and complete, or nearly so, only in the next generation.
To see what the slopes imply, choose a group, then set how much the natives of each country take part. The bar shows how much of the predicted, culture-linked participation comes from each side.
Pick a group and set how much the natives of each country take part. The tool weighs each country by the paper’s slope for that group.
First generation, in the country 20 years or less. 0.05 × 0.615 + 0.30 × 0.496 = 0.180 on the 0 to 1 scale. Slopes: Table 3, Model 2b.
This is the part of predicted participation linked to the two countries. It leaves out everything else about a person, so it is not a forecast for anyone.
| Group | Old country | New country | Source |
|---|---|---|---|
| First generation, 20 years or less | 0.615 | 0.496 | Table 3, Model 2b |
| First generation, more than 20 years | 0.439 | 0.688 | Table 3, Model 2b, main term plus interaction |
| Second generation | 0.168 | 0.957 | Table 2, Model 1b, main term plus interaction |
| Everyone | 0.375 | 0.755 | Table 2, Model 1a |
Part 6 · The street outside
Immigrants resemble the natives down the road
Everything so far could still be explained from the top down. Countries differ in their integration policies, their citizenship rules and their public mood towards immigrants. A generous national policy might make immigrants more active and also go along with a more participatory native population. Generation and time in the country would then simply measure how long someone has been exposed to the policy.
There were hints that something more local was at work. Comparing immigrants across Europe, Maxwell found that their political trust and satisfaction were closer to those of native-born people in the same region than to those of migrants living elsewhere. Luttmer and Singhal found that the attitudes to redistribution of immigrants’ countries of origin persisted more strongly among immigrants living among many others from the same background, and so among fewer natives.
The regional test gets around the national explanation. National policies are the same everywhere in a country, but regions within a country differ in how much their natives participate. If immigrants resemble the natives of their own region more than natives elsewhere in the same country, the explanation is unlikely to be a national policy and more likely to be the people nearby.
So we computed natives’ average participation for each region of each country, and asked whether immigrants follow it. The strongest version of the test compares immigrants from the same country of origin, living in different regions of the same destination country.
Immigrants track the natives of their own region
Slope of immigrants’ participation on natives’ average participation in their region, with 95% intervals
Published Table 4. Models 3b to 3e hold both the country of origin and the country of residence fixed, so they compare immigrants with the same origin living in different regions of the same country. Up to 55,455 people in 529 regions. 95% intervals computed here as ±1.96 reported standard errors.
With both the national and the regional average in the model, the region still matters: a slope of 0.445 on the natives of one’s own region.
Now hold both countries fixed, so that every national difference drops out. The regional slope is 0.532, or 0.473 with the wider set of origins, across as many as 529 regions.
Removing all national variation makes the regional pull slightly stronger.
The regional pull is larger for the second generation, by +0.251, and for first generation immigrants who have lived in the country more than twenty years, by +0.144.
The same dose response appears at the scale of the neighbourhood as at the scale of the country.
This is our strongest evidence for the mechanism. A national integration law cannot explain why an immigrant in one region of a country takes part more than an immigrant from the same origin in another region of the same country, but the natives they live among can.
A tentative look at friends and colleagues
In two survey rounds, respondents were also asked whether they had friends, colleagues and neighbours from immigrant or minority backgrounds. The results suggest that close ties work asymmetrically. None of these ties made a discernible difference to how much people took on the new country’s habits. But people with immigrant friends kept more of the old country’s culture (p = 0.050), and perhaps also people with immigrant colleagues (p = 0.102).
One reading is that the new country’s habits arrive through weak ties and casual observation, while the old country’s are kept alive by close ones. The sample is smaller and the estimates are less certain, so we treat this as a lead for future work rather than a finding.
Part 7 · What it means
Political habits are learned, and learned again
Put together, the evidence describes political culture as something closer to a habit than an inheritance. People bring the participatory culture of the country where they grew up, and it stays with them for a while. With time, and especially across a generation, they take on the culture of the people around them, down to the level of the region they live in. The old country never disappears completely, and the new one never takes over at once.
For the study of political culture, the main lesson is about where culture lives. Much writing treats it as a property of nations, transmitted down the generations within families and schools. The regional result suggests that it also lives in places, in the ordinary behaviour of the people one sees every day, and that it spreads sideways from them as much as downwards from parents. The quieter forms of influence, casual observation and imitation, deserve more attention than political scientists have given them.
The other chapters of the dissertation point the same way from different angles. On the Danish–German border, a change of state left differences in voting that faded within 40 to 70 years, and no consistent trace in trust today. In African regions, Christian and Muslim regions under the same institutions turned out to be rated as similarly democratic. Here, people who change country take on its habits within a generation. In each case, culture follows the institutions and the people around it more closely than the deep-history view expects.
This matters now because debates about immigration in Europe often turn on whether newcomers and their children will ever share the political habits of the societies they join. Our findings give room for careful optimism. Immigrants do come to take part in politics like their neighbours, and their children more so. In the dissertation version of the paper we also noted that the flow of immigrants runs mainly from countries with lower participation to countries with higher participation, which makes adaptation mostly a move towards more engagement. With gradual parity in participation comes a better chance of having one’s preferences heard, and in time represented.
None of this happens quickly; it takes time, as we wrote, “even generations”. And because the habits that rub off are those of the people nearby, where immigrants live, work and send their children to school shapes what they learn. Integration policy matters, and much of political integration also seems to happen on the street outside.
Where do immigrants learn to take part in politics? Mostly from the people around them.